BTC may have exited the old cycle: Was October the peak, or is this the beginning of a new cycle?

Since the new cycle began from BTC's low point in November 2022, it has experienced several phases, including long-term accumulation, ETF fund inflows, the halving event, and policy-driven fluctuations. Currently, BTC is at a key juncture between the old and new cycles. Summary generated by Mars AI. The accuracy and completeness of this summary are still being iteratively improved by the Mars AI model.
According to Coinbase quotes, BTC reached a four-year low of $15,460.00 per coin on November 21, 2022. We regard this day as the end of the previous cycle and the beginning of the current cycle.
From that day until September 30 this year, BTC has been running turbulently for 1,044 days, and in terms of time, it is already close to the peak of the previous two cycles (about 1,060 days after the low point). If we calculate rigidly, BTC will reach the peak of this cycle in October 2025.
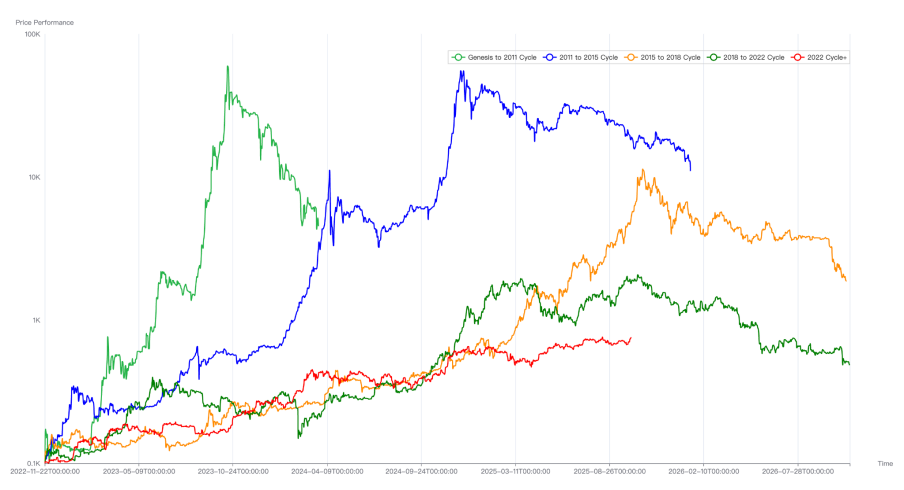
Comparison of BTC price trends over 5 cycles
This "cycle law" curse of BTC originates from the speculative frenzy brought about by consensus diffusion and halving, and it is still the most valued cycle indicator for traditional large BTC holders. This group has played a decisive role in shaping past BTC tops. It is precisely the frenzied profit-taking and selling of this group that drains liquidity and ultimately forges the market cycle peak.
Currently, this group is accelerating their selling, and it seems the "peak" is imminent. However, other top indicators such as rapid price surges and sudden increases in new addresses have not appeared. This is confusing—will this "cycle law" continue to suppress the market and shape the cycle top, or will it fail this time? Will this BTC bull market that started in November 2022 end in October?
In this report, EMC Labs uses its self-developed "BTC Cycle Multi-factor Analysis Model" to conduct a comprehensive analysis of BTC price trends since the beginning of this cycle, clarifying which market forces and underlying logic have truly driven the cycle, and finally providing our analysis and judgment on whether BTC will peak in October.
Phase One (2022.11~2023.09): Long-term Holders Accumulate
Looking back at history, the bankruptcy of major buyers in the previous cycle such as FTX and its lender Voyager Digital marked the completion of the cycle's clearing. After FTX's bankruptcy, BTC price fell from the bottom range of $20,000 to $15,476 (Coinbase data, same below), with the lowest point appearing on November 21, 2024.
The bankruptcy of FTX and other institutions intensified the market bottoming, but the fundamental force that determined the end of the cycle was the profit-taking and selling by long-term holders. In times of market frenzy, short-term holders scramble to buy while long-term holders sell; in times of market cooling, short-term holders sell at a loss while long-term holders turn to accumulate.
Position changes of long-term holders in the previous cycle
As in previous cycles, long-term holders began accumulating chips during the bear market phase of the last cycle. Entering the bottom stage, the scale of loss-selling by short-term holders began to decrease, and the buying power of long-term holders began to turn into upward momentum, pushing BTC and the crypto market out of the bottom and into a new cycle.
Meanwhile, in the post-pandemic era, the Fed's rate hike cycle was approaching its end and officially ended on July 26, 2023. Due to forward-looking trading, the Nasdaq Composite Index bottomed out on October 13, 2022, and exited the bottom range in January 2023. BTC's price basically synchronized with this, about 9-10 months ahead of the official end of rate hikes.
As the rate hike cycle neared its end, tightening liquidity led to bankruptcies of US regional banks (Silicon Valley Bank, First Republic Bank), and the US government was forced to urgently release liquidity. The US M2/DXY index began to bottom out and rebound, providing an external environment for the rebound of the US stock market and BTC.
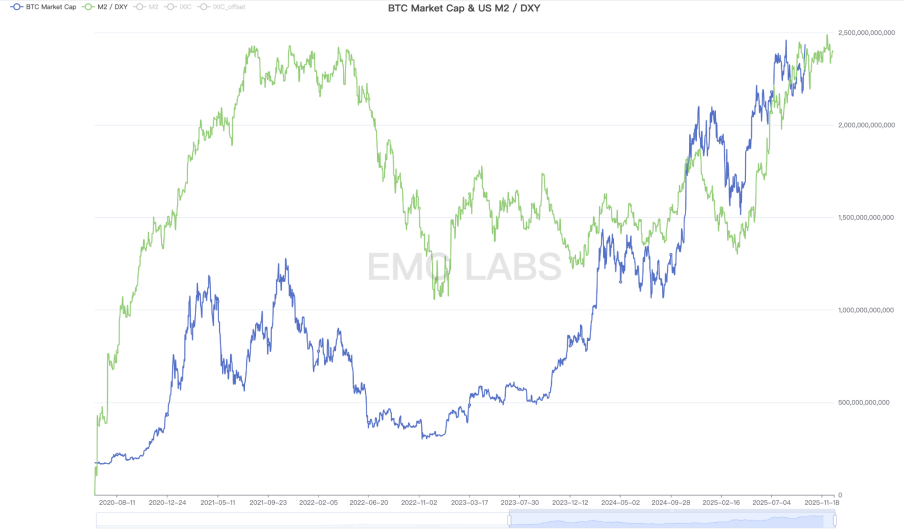
US M2/DXY
We define "2022.11~2023.09" as the first phase of this cycle. With the improvement of macro liquidity, the tension generated by the internal holding structure of the crypto market became the fundamental driving force for BTC price increases in this phase.
The Fed's rate hikes officially ended in July 2023, and the accumulation behavior of long-term holders continued until the end of September 2023.
At this time, the now-prominent DATs companies and BTC Spot ETF had not yet become dominant forces, and the retail group chasing highs and cutting losses had not yet awakened. During this phase, stablecoin issuance was shrinking, and funds were still flowing out of the crypto market. The cyclical accumulation by long-term holders was the main driving force for the market's rise.
In the first phase, BTC rebounded from a low of $15,476.00 to a high of $31,862.21, a maximum increase of 105.88%.
Phase Two (2023.10~2024.03): BTC Spot ETF
US inflation continued to fall, and the brief rebound in CPI from July to September 2023 was considered a false alarm. July was finally confirmed as the end month of the Fed's rate hike cycle.
With changes in market expectations, risk assets began to be favored by funds, and the change in risk appetite prepared BTC for the second phase of the rally.
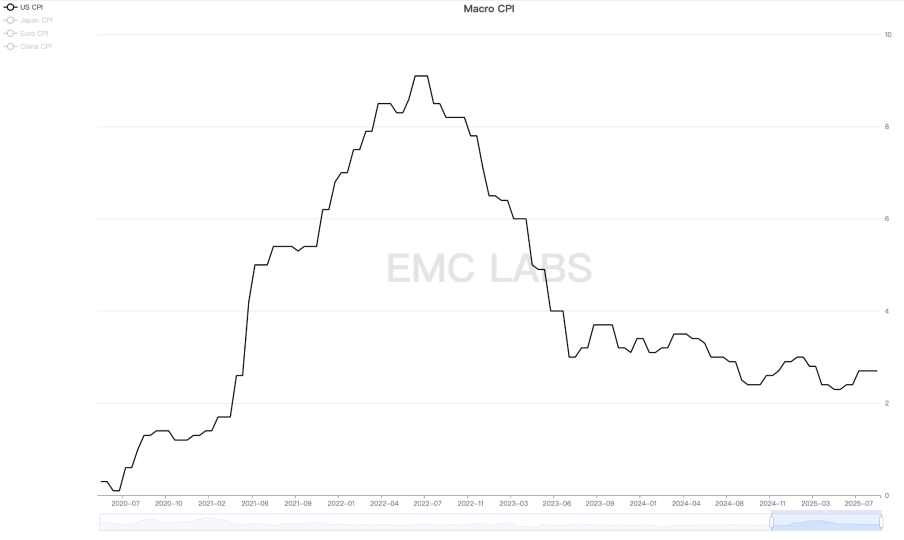
US CPI
The real driver of BTC's second phase rally in this cycle was the expectation of BTC Spot ETF approval and the fifth BTC halving in April 2024.
Wall Street asset management giants such as BlackRock and Fidelity submitted BTC Spot ETF applications to the SEC in June 2023, and forward-looking speculative funds quietly gathered.
Taking January 10, 2024, when the SEC approved the BTC Spot ETF, as the dividing line, the second phase can be split into two halves: the first half (2023.10~2024.01.10) was dominated by speculative funds betting on ETF approval, and the second half (2024.01.10~2024.03.14) was dominated by incremental funds (over $12 billion) brought in by the ETF channel.
Monthly statistics of BTC Spot ETF and stablecoin channel fund flows
In addition, the stablecoin channel completely reversed its outflow trend in October and resumed inflows. By the end of March, more than $26 billion in new issuance had been added, making it one of the main driving forces in the first half.
Since the start of this phase in October 2024, long-term holders began to reduce their holdings, with the scale of reduction reaching as much as 900,000 coins by the end of the rally.
This phase was jointly dominated by speculative/investment funds from the BTC Spot ETF channel, on-exchange speculative/investment funds (manifested as a large increase in stablecoin issuance), and long-term holders reducing their positions. Buying power exceeded selling power, BTC prices rose sharply, and the rally was very fierce.
In the second phase, BTC rose from a low of $26,955.25 to a high of $73,835.57, a maximum increase of 173.92%.
Phase Three (2024.04~2024.09): Halving Rebalancing
In the analysis of the second phase, we pointed out that investment/speculative funds based on the traditional BTC halving narrative were also important factors in determining the rally. This is clearly reflected in the third phase.
On April 19, 2024, BTC completed its fourth halving, with block rewards dropping from 6.25 BTC to 3.125 BTC. Although more than 95% of BTC is already in circulation and the actual impact of halving on market supply has greatly diminished, the speculative rally around the halving did indeed exhaust BTC's upside potential. From April 2024 to September, BTC entered a seven-month period of volatility and adjustment.
Fund statistics show that after BTC reached a stage high in March, the scale of capital inflows into the BTC Spot ETF channel shrank but remained at a high level, while the stablecoin channel shrank even more, even turning to outflows at times.

Monthly statistics of BTC Spot ETF and stablecoin channel fund flows
During this period, although the Fed had stopped raising rates, rate cuts had not yet begun. The scale of ETF channel inflows was significantly reduced, and combined with on-exchange funds leaving as the halving approached, the exhausted rally had to be revised downward to seek a new price equilibrium.
The market was able to rebalance without falling into a bear market, thanks to the stabilizing force of long-term holders. We noticed that after April, as liquidity receded, long-term holders stopped reducing their positions and began accumulating again after July. The behavior of long-term holders is consistent with their historical characteristics, outlining a stage bottom range for the market.
In the third phase, the highest price was $109,588, the lowest was $74,508, and the maximum decline was 32.01%, which did not exceed the BTC bull market pullback threshold.
Phase Four (2024.10~2025.01): Trump’s Crypto-Friendly Policies
Since the end of rate hikes in July 2023, the federal funds rate has remained high at 5.25~5.50 to suppress CPI decline. High interest rates gradually damaged the job market, and the Fed finally restarted rate cuts at the September 2024 FOMC meeting, completing a total of 75 basis points of cuts by the end of the year.
Rate cuts boosted risk appetite across the market, and funds poured into the crypto market through BTC Spot ETF and stablecoin channels. By the end of January 2025, the AUM of the 11 US BTC Spot ETFs exceeded $100 billions, setting multiple historical records. This shows that the "digital gold" narrative of BTC has been embraced by Wall Street, and BTC is transitioning from an alternative asset to a mainstream asset.
In addition to rate cuts, another catalyst for BTC's rise was the US presidential election. In this election, Republican candidate Donald John Trump made a 180-degree turn in his attitude toward cryptocurrencies, becoming the most "crypto-friendly" presidential candidate in US history. His family business even issued the MEME token Trump after his victory.
After taking office, Trump signed executive orders supporting digital assets and blockchain technology, established an interdepartmental task force to review existing regulatory policies, announced the establishment of a "Bitcoin Strategic Reserve" and "US Digital Asset Reserve," and signed the "GENIUS Act" to promote the compliant development of stablecoins. In addition, he appointed "crypto-friendly" individuals as Treasury Secretary and SEC Chairman, effectively promoting the development of crypto assets and blockchain technology in the US. The friendliness of his attitude and the intensity of his policies are unprecedented—so much so that even Satoshi Nakamoto would find it hard to believe.
With Trump’s campaign, massive funds quickly flowed into the crypto market through ETF and stablecoin channels, forming the largest capital inflow of this cycle so far. At the same time, long-term holders began selling again to lock in profits.
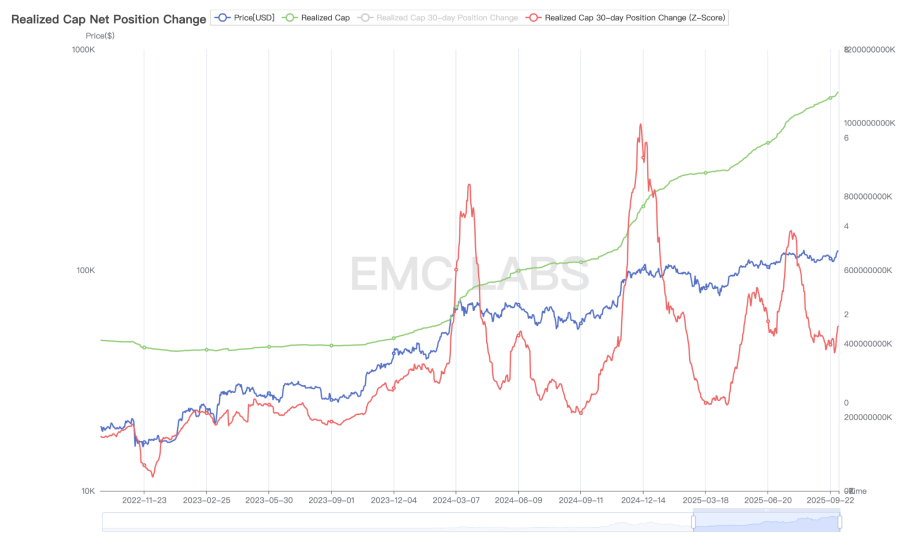
On-chain realized value statistics for the Bitcoin network
Driven by US crypto-friendly policies, crypto assets gradually became mainstream US assets. In addition to BTC Spot ETF, dozens of DATs companies represented by Strategy joined the battle to hoard BTC and other crypto assets. These two groups have become the largest buyers in the BTC market.
The BTC held by BTC Spot ETF and DATs companies has exceeded or is approaching 5%.
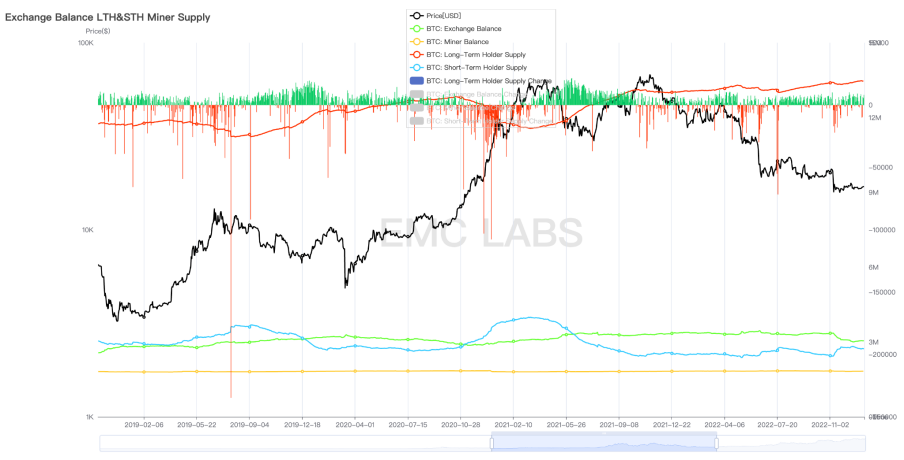
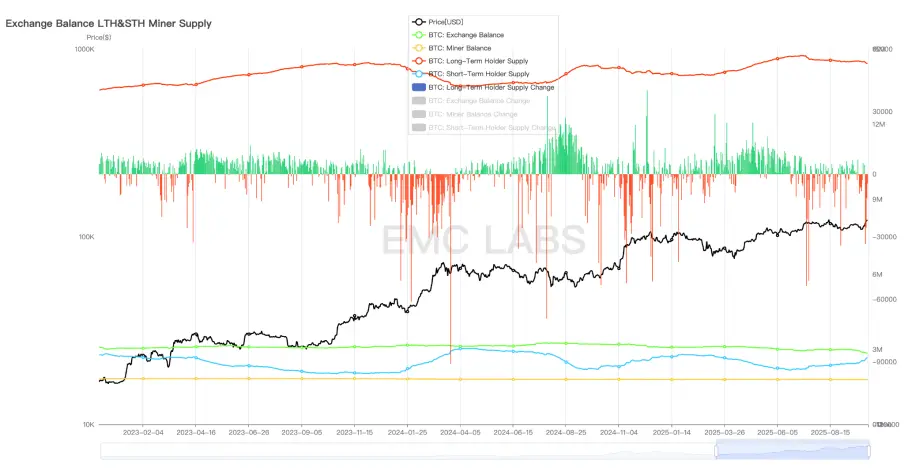
With the large-scale involvement of BTC Spot ETF and DATs companies, BTC has entered a new era of major turnover. A large amount of BTC is being transferred from early holders to the custody accounts of BTC Spot ETF and DATs companies. This has caused the BTC held by centralized exchanges, which early crypto holders used to rely on, to decline sharply in this phase. By the end of September 2025, more than 400,000 BTC had flowed out of centralized exchange management addresses, worth over $40 billions at $100,000 per coin.
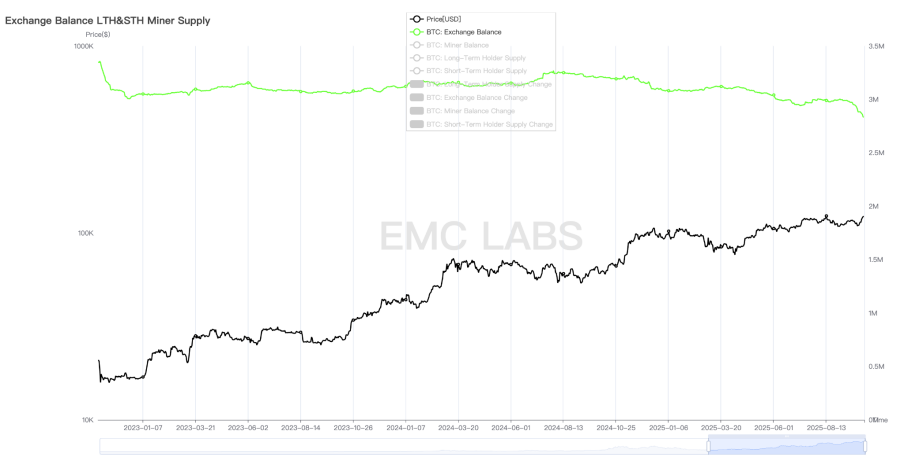
BTC inventory statistics of major crypto asset exchanges
This outflow continues in this phase and beyond, showing that BTC is currently undergoing a historic turnover. Early investors (including those holding for more than 7 years) are cashing out huge profits and exiting, while traditional funds are becoming long-term investors in this asset. The behavior of early investors is greatly affected by the halving cycle, while DATs companies seem to prefer continuous buying and long-term holding, and BTC Spot ETF holders are more influenced by US stock market trends.
This change in holding structure has made BTC's cycle formation more complex.
The market momentum in this phase comes from speculative behavior driven by expectations of rate cuts and Trump’s crypto-friendly policies, resulting in record capital inflows into the crypto market.
In the fourth phase, BTC price was pushed from a low of $63,301.25 to $109,358.01 (recorded on Trump’s inauguration day, January 20, 2025, UTC+8), with a maximum increase of 72.76%.
Phase Five (2025.02~2025.04): Black Swan
In our research framework, the fifth phase is another mid-term adjustment formed by the combination of external black swan events and the emotional retreat after speculative frenzy. The market turmoil caused by the pause in rate cuts and the tariff war reached a threshold in both time and space, ultimately forming this special phase.
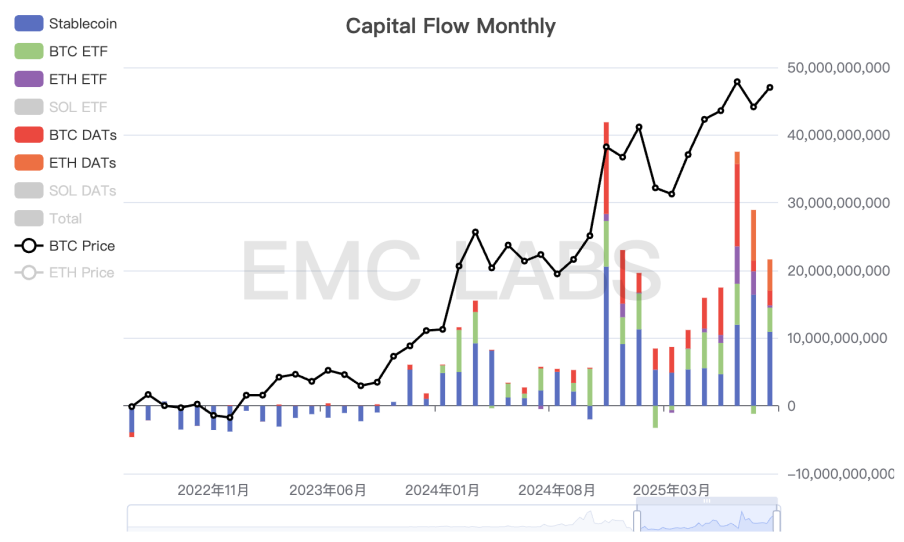
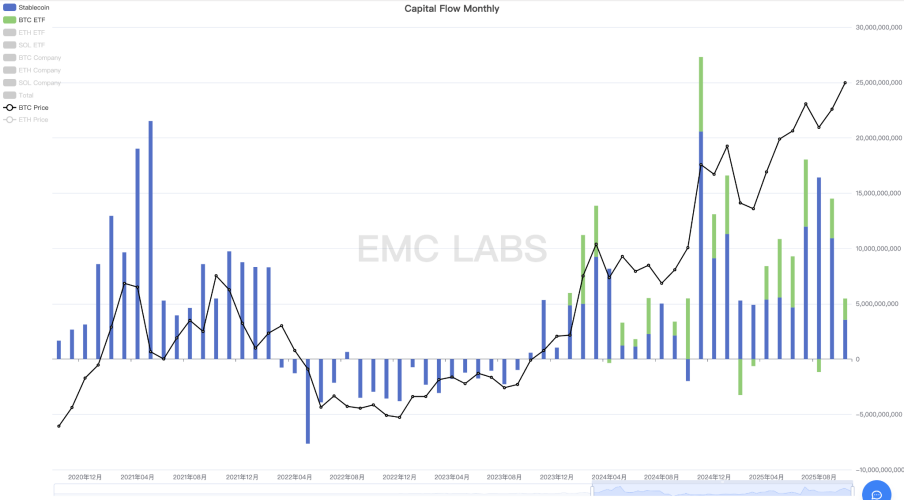
Monthly statistics of crypto market fund flows
Because the US stock and crypto markets had already priced in continued rate cuts, when the Fed stopped cutting rates in January 2025 and stated it would refocus on reducing inflation, the US stock market and BTC, both at historical highs, entered a precarious state. When Trump announced tariff rates far beyond expectations, the market plunged into a crash mode.
The Nasdaq saw a maximum correction of nearly 17% from its high, and BTC’s maximum correction reached 32% (UTC+8). Although BTC's decline was large, it did not exceed the pullback threshold in a BTC bull market.
Ultimately, as panic from the tariff war and concerns about a US economic hard landing subsided, both the US stock and crypto markets achieved a V-shaped reversal in April, and continued to hit new highs after July.
Behind the V-shaped reversal, DATs companies, BTC Spot ETF channels, and stablecoin channel funds rushed to buy, and long-term holders returned to accumulation after the decline, once again playing the role of market stabilizer.
In the fifth phase, the highest price was $73,777, the lowest was $49,000 (UTC+8), and the maximum decline was 33.58%, which did not exceed the scale of BTC bull market corrections.
Phase Six (2025.05~): Old Cycle and New Cycle
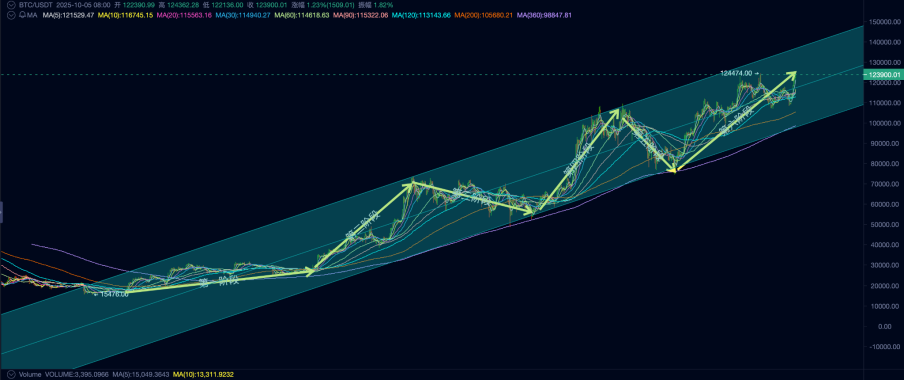
The market crash caused by the black swan was gradually recovered by bottom-fishing funds and long-term accumulation. By July, BTC had reached a new all-time high of $123,000 (UTC+8).
At this point, long-term holders started the third major sell-off of this cycle, which continues to this day. The buyers are DATs and BTC Spot ETF channel funds.
Before the rate cut in September, forward-looking trading continued to dominate the market. From July to September, there was a large inflow of funds, but the scale of inflows decreased, causing BTC to experience a slight adjustment after the rate cut. Long-term holder selling became the main activity affecting market movement.
BTC long-term holder position change statistics
Since the beginning of this cycle, with the third wave of increases, long-term holders are conducting the third large-scale sell-off. According to on-chain data, long-term holders have locked in profits on more than 3.5 million BTC this cycle, a scale that has reached the threshold of previous cycle tops. As of today, long-term holders are still selling BTC heavily.
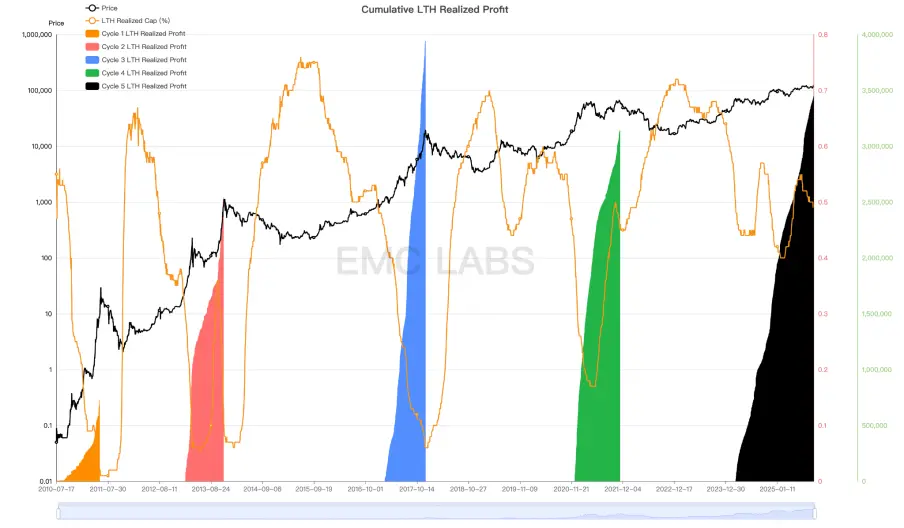
BTC long-term holders realized profit (BTC) statistics
In past bull-bear cycles formed by BTC halving, BTC halving and the accumulation and distribution of chips by long-term holders were decisive factors in forming the cycle, while the speculative sentiment around halving that drove new investors into the market was a necessary condition for forming the cycle top. In previous cycles, this speculative influx of newcomers was manifested by a surge in new addresses on the Bitcoin network.
However, as BTC consensus spreads, the number of new addresses that BTC can stimulate to create in each cycle has stagnated. Since 2024, new BTC addresses have fallen to levels seen in previous bear markets. Of course, this cannot simply be interpreted as a decrease in new participants, because after the approval of 11 US BTC Spot ETFs in January 2024, many investors began to participate via the ETF channel, greatly reducing the creation of BTC wallet addresses.
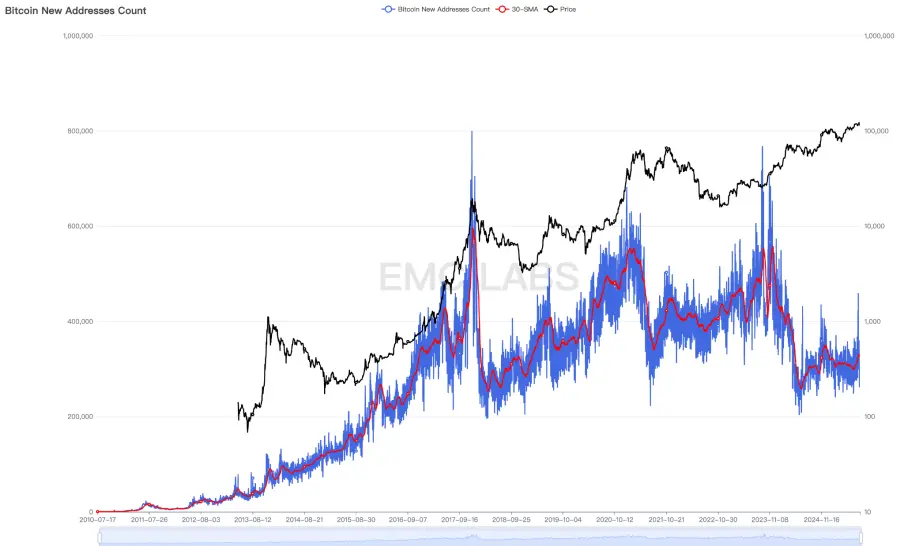
Bitcoin network new address statistics
But when observing the largest SCP platform, Ethereum, we can see the same situation with new addresses in this cycle.
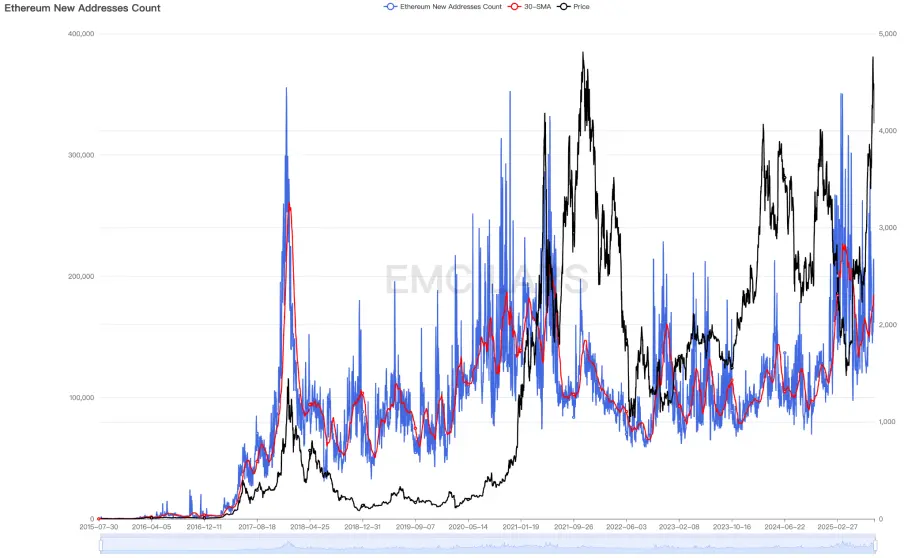
Ethereum new address statistics
This forces us to believe that the BTC market structure has undergone a dramatic change, and the entire crypto market is entering a new stage of development. Simply predicting the market top according to the cycle law, or blindly chasing hot coins and expecting high returns, is now outdated.
BTC may have already exited the old cycle and entered a new one, and its way of peaking, timing of the peak, and the magnitude of bear market corrections may all change completely.
Conclusion
From the above review and observations, we draw a preliminary conclusion: the driving force behind this bull market mainly comes from industrial policy incentives and incremental funds from traditional channels. Halving and industrial innovation have not brought in huge capital inflows as before, thus failing to trigger a comprehensive bull market with all coins soaring in the crypto market.
Although during this bull market, the industry also saw innovations in areas such as Ethereum Layer 2, BTC Ordinals, Restaking, Solana revival, and DePhin, the funds attracted by these innovations were pulse-like and extremely limited compared to the previous ICO and DeFi booms.
This has resulted in most coins and tokens in the crypto market only experiencing pulse-like, phased increases since BTC restarted the new cycle bull market in November 2022. Even the SCP platform token ETH, which has the greatest consensus and most use cases, saw its price in 2025 once fall back to pre-bull market levels.
BTC is moving out of the old cycle and into a new one. Funds from DATs companies and BTC Spot ETF channels, driven by market sentiment and their own logic, are trying to reshape the logic and form of the cycle. However, the BTC long-term holder group, which has played a decisive role in cycle movements over the past 16 years, still holds more than 15 million BTC, accounting for as much as 70% of issued BTC, and this group still acts according to the cycle law.
Factors supporting the view that the top has not yet been reached or that a new cycle has begun include: the outstanding fundraising ability and long-term holding strategy of DATs companies, the continued rollout and implementation of crypto-friendly policies in the US, and the trend of high-risk asset allocation triggered by the restart of the rate cut cycle.
Will long-term holders drain liquidity and complete the old cycle top, or will buying power in a rate-cut environment bury selling pressure and follow US stocks into a long bull new cycle? This game is still ongoing.
We tend to believe the cycle will be appropriately extended, and BTC peaking in October remains a low-probability event. However, if long-term holders persist in continuous selling, it is highly likely that the bull market will end this year. The time and space for the bear market adjustment after the bull market may be greatly reduced, depending on the behavior of new buyers.
The end has already begun.
Disclaimer: The content of this article solely reflects the author's opinion and does not represent the platform in any capacity. This article is not intended to serve as a reference for making investment decisions.
You may also like
On vacation but still earning: Achieve "passive income" during National Day with Bitget GetAgent
GetAgent brings not only profits, but also a sense of liberation.

The Future of Bitcoin Smart Contracts with OP_CAT and sCrypt: In-Depth Analysis with Xiaohui Liu
A new chapter for Bitcoin: OP_CAT activates smart contracts, and the CAT protocol expands application boundaries.

From Plunge to Prosperity: Bitcoin and Ethereum’s Stellar Recovery in Market Value

Raydium Price Targets $1.50 Zone After 4.55% Drop From $2.83 Level