Date: Mon, Oct 13, 2025 | 09:10 AM GMT
The cryptocurrency market is making a notable comeback today after last week’s massive crash that dragged Ethereum (ETH) to a low of $3,447 before rebounding to around $4,150, marking a 8% jump in the past 24 hours. Alongside Ethereum’s recovery, major memecoins are also showing renewed strength — including SPX6900 (SPX).
Today, SPX is back in the green with an impressive 22% jump, and more importantly, it has successfully retested a key breakout zone — a move that could set the stage for its next major bullish leg upward.
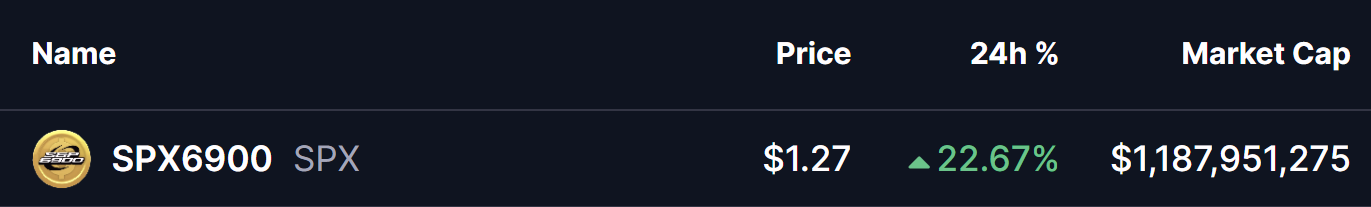 Source: Coinmarketcap
Falling Wedge Breakout Retest
On the daily chart, SPX had been consolidating within a falling wedge pattern for several weeks — a formation widely recognized as a bullish reversal setup that often precedes strong upward moves once the price breaks out of the pattern.
Before the recent market crash, SPX broke above the wedge’s resistance near $1.20, fueling a sharp rally that took the token to a local high of $1.66. However, the broader market sell-off temporarily halted its momentum, pushing SPX down to as low as $0.44.
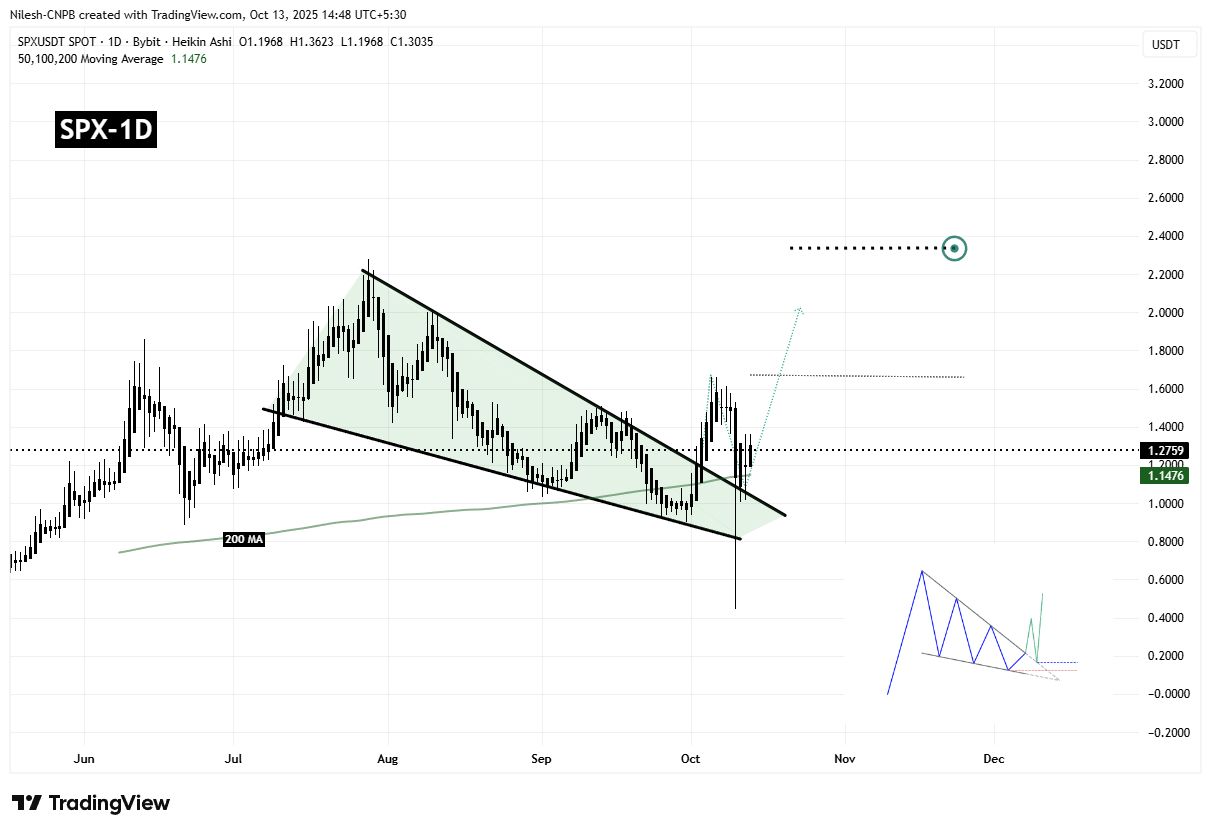 SPX6900 (SPX) Daily Chart/Coinsprobe (Source: Tradingview)
If we ignore that extreme low wick (caused by panic-driven liquidations), the price successfully retested the breakout trendline near $1.07 — a classic post-breakout retest that often confirms the breakout’s validity. Since then, SPX has reclaimed the 200-day moving average (MA) at $1.1476 and is now trading around $1.27, hinting at a renewed bullish push.
What’s Next for SPX?
The technical structure looks encouraging, but the next few sessions will be crucial in determining whether SPX can sustain this momentum. If buyers manage to hold the price above the 200-day MA and reclaim the recent local high of $1.66, it could confirm the continuation of the bullish trend.
In that scenario, the next key target lies around $2.33, which represents the measured move projection from the wedge breakout — implying a potential 84% upside from current levels.
However, if SPX fails to defend the 200-day MA, it could slip back inside the wedge, potentially invalidating the bullish setup and delaying any major recovery attempt.