Date: Mon, Oct 20, 2025 | 11:35 AM GMT
The cryptocurrency market is starting the new week on a bullish note after last week’s choppy momentum. Both Bitcoin (BTC) and Ethereum (ETH) are trading higher, gaining over 2% each, which has helped lift sentiment across major memecoins , including Bonk (BONK).
BONK has climbed more than 5% today, extending its upward momentum as a key harmonic pattern on its chart signals that the rally could still have more room to grow.
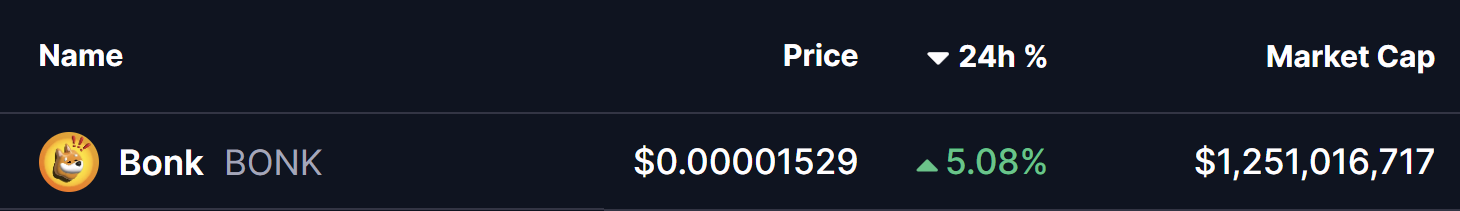 Source: Coinmarketcap
Harmonic Pattern Hints at Potential Upside
On the 4-hour chart, Bonk (BONK) appears to be forming a Bearish Bat harmonic pattern. Despite the “bearish” name, the structure often experiences a strong bullish leg during its final phase (CD leg) before completing near the Potential Reversal Zone (PRZ).
The pattern originated at Point X near $0.00002217, followed by a sharp correction to Point A, a rebound to Point B, and a secondary pullback to Point C around $0.00001316. From that low, BONK has started to recover steadily and is currently trading near $0.00001529, showing early signs of strengthening momentum.
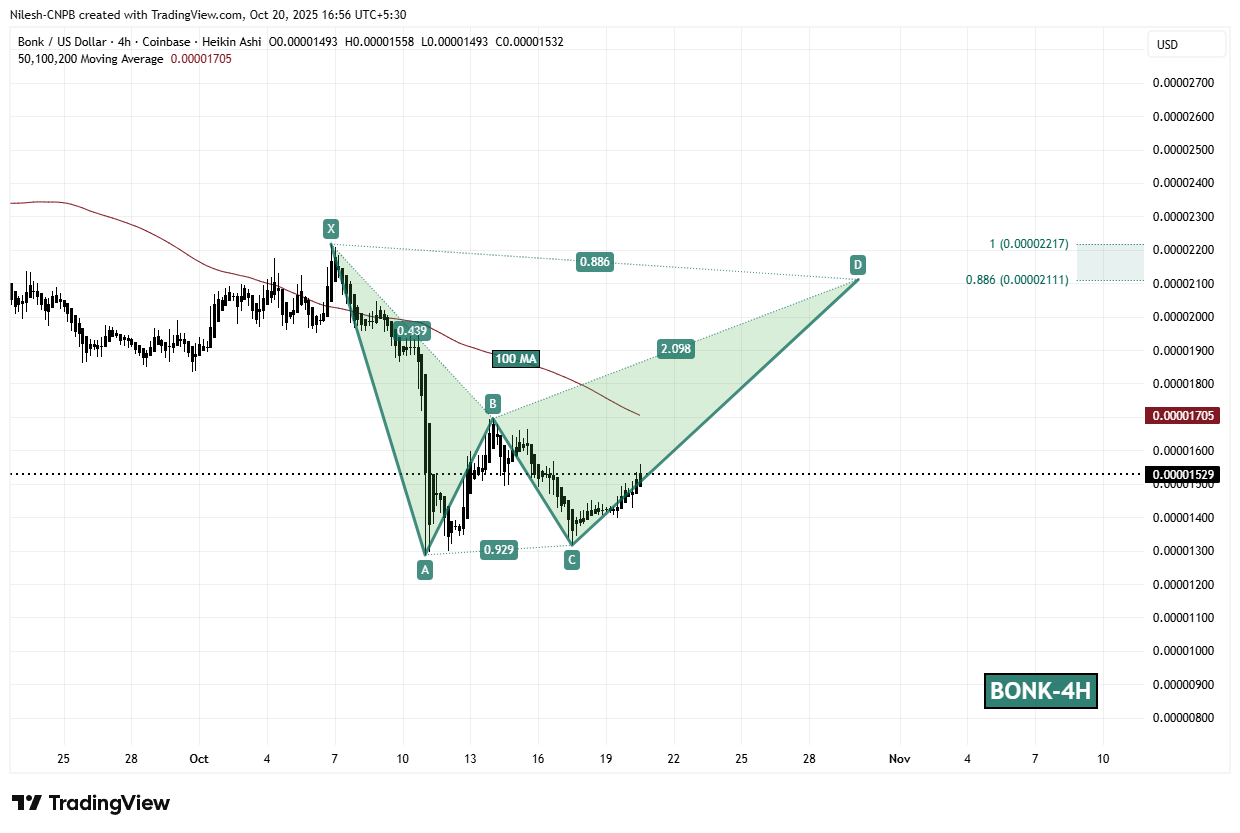 Bonk (BONK) 4H Chart/Coinsprobe (Source: Tradingview)
Importantly, BONK is now positioned just below its 100-hour moving average (MA) at $0.00001705, which serves as a critical breakout level. A confirmed breakout above this line could flip resistance into support, potentially accelerating the next bullish leg toward the PRZ.
What’s Next for BONK?
If buyers manage to hold the support near $0.00001465 and push prices above the 100-hour MA, the Bat pattern projects a potential rally toward the PRZ zone between $0.00002111 and $0.00002217 — representing an upside of around 45% from the current price.
These levels correspond to the 0.886 and 1.0 Fibonacci extensions, which are often key completion points for harmonic structures. Historically, such setups tend to see strong momentum until these targets are reached.
However, if BONK fails to maintain support within the CD leg, the pattern’s bullish outlook could lose strength, opening the door for short-term correction before another rebound attempt.