Crypto Market Prediction: Shiba Inu (SHIB) Fundamental Support Here, XRP's Chance for $3 Springboard, Ethereum (ETH) $3,500 Comes Next

The composition of the market certainly raises questions, as no clear direction can be choosen at this point in time, especially if we take into consideration the fact that Bitcoin has not yet recovered. Altcoins are also lagging behind: Ethereum is back to bleeding out, Shiba Inu might form a third leg down and XRP is clearly struggling in the short term, with a better outlook in the midterm.
Shiba Inu's strong recovery base
It appears that Shiba Inu is finally gaining traction after weeks of unrelenting sales. The meme coin may be forming a strong base for a recovery after touching a critical three-point support zone. The psychologically significant $0.000010 level, which has historically served as both support and resistance in previous consolidation phases, is currently just below SHIB’s trading level of $0.0000099.
SHIB’s chart clearly demonstrates the exhaustion of selling momentum as viewed from a technical standpoint. The asset has made three trips back to this lower range in the last month, possibly creating a triple-bottom structure — a pattern frequently linked to accumulations or reversals.
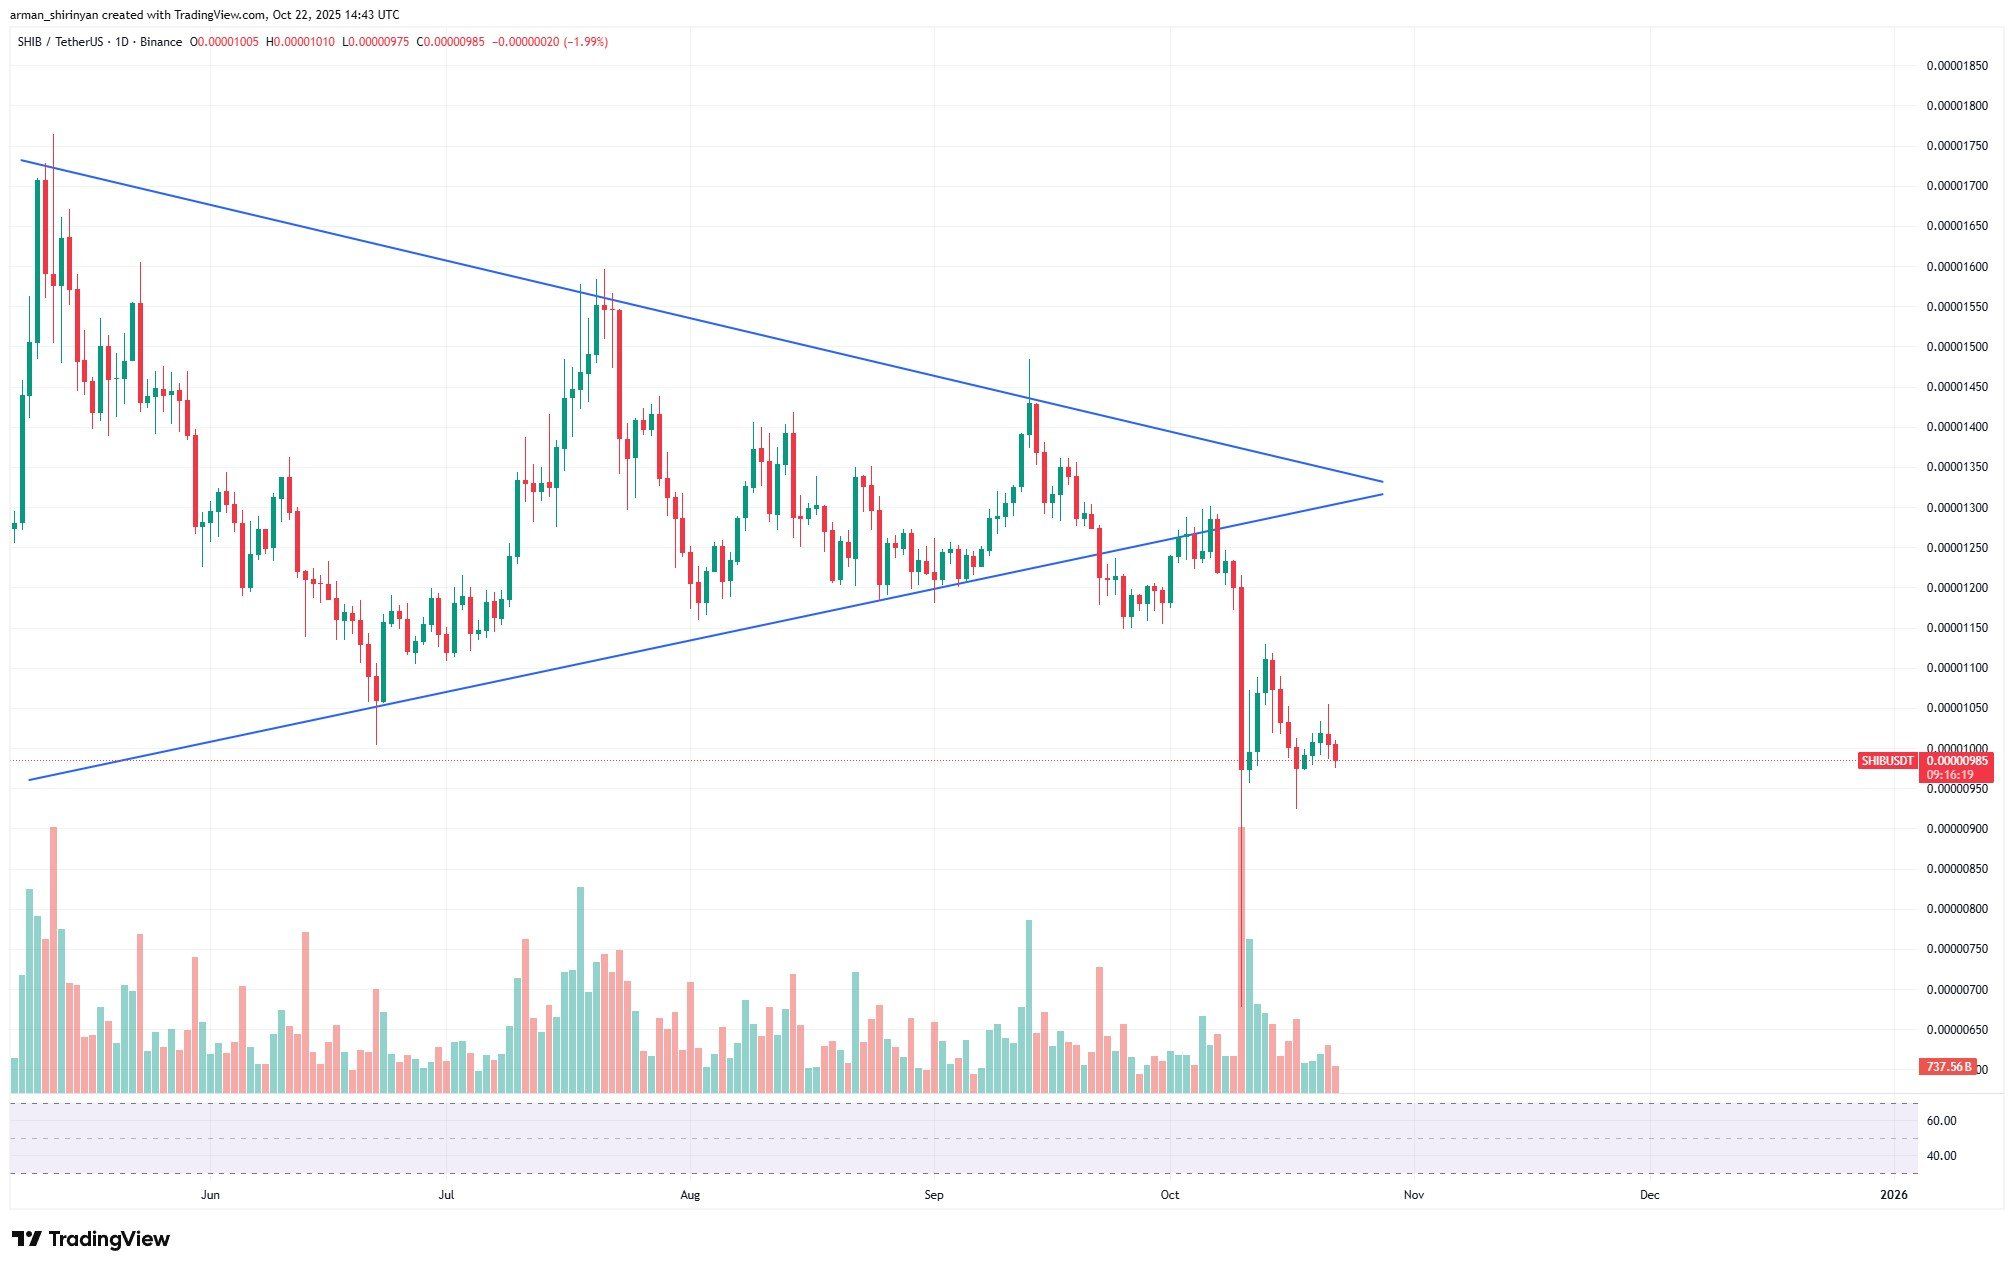
In addition, trading volume has begun to level off following the steep spike in liquidations that occurred during the crash in early October, indicating that buyers may be quietly taking over as sellers may be losing ground.
Another clue that SHIB may be on the verge of hitting a short-term bottom is the Relative Strength Index (RSI), which is currently hovering around 37 and is close to oversold territory. The price is still below significant moving averages such as the 50-, 100- and 200-day ones, which are currently serving as overhead resistance between $0.0000112 and $0.0000131.
A brief relief rally toward the $0.0000105-$0.0000110 region might be triggered by a break above those levels. However, there may be greater downside risk if this emerging support is not held. The next important area to keep an eye on if SHIB drops below $0.0000095 is $0.0000088, where the prior long-term trendline may reengage.
After a harsh correction, the market structure currently indicates that SHIB is trying to lay a new foundation. It may serve as the launching pad for a subsequent upward leg if the triple-touch structure holds, but confirmation will rely on whether volume and market confidence pick back up in the days ahead.
XRP's structure got cracked
It appears that XRP is preparing for a significant breakout following a tumultuous few weeks. The narrowing triangle pattern, a technical structure that frequently precedes a strong move in either direction, has been the token’s consolidation pattern.
XRP, which is currently trading close to $2.38, looks to be completing this setup which, if bullish momentum returns, could act as a volatility springboard toward the $3 mark. The daily chart shows that the price of XRP has been continuously compressing between horizontal support and a descending resistance line around $2 and $20.
The pattern indicates that traders are awaiting a clear move as volatility is decreasing. When the price closes firmly outside the upper boundary, such symmetrical triangles have historically produced breakouts, which are usually followed by an increase in trading volume. XRP may start a rally toward the psychological barrier of $3 if it can break above the $2.60-$2.70 resistance zone.
This would be in line with the 50-day and 100-day moving averages, which are currently above the price. A strong breakout would also change the market’s attitude, which is still cautious after a sharp flash crash earlier this month and a recent 50% volume drop.
Given that the Relative Strength Index (RSI) is close to 39, it appears that XRP is not yet overbought, allowing for an upward extension should momentum pick up speed. This consolidation phase is crucial for XRP’s next direction, though, as failure to hold support at $2.20 could invalidate the pattern and push the asset toward $2.00 or even $1.70.
To put it simply, XRP is at a turning point that may affect its course in the near future. The current stagnation could become a strong bullish reversal, with a confirmed breakout from the forming triangle, paving the way for a possible rally toward $3 in the coming weeks.
Ethereum's ground is gone
After multiple failed attempts to keep momentum above the $4,000 mark, Ethereum looks to be losing ground. Given the asset’s recent performance, $3,500, a crucial support level that is in line with the 200-day moving average on the chart, might be the next sensible stop.
After several rejections at $4,200, a resistance zone supported by the 50-day and 100-day moving averages, ETH has begun to experience increasing selling pressure and is currently trading close to $3,880. Because of this resistance cluster, the region is now a strong supply zone, making Ethereum susceptible to further declines.
Before ETH hits oversold territory, there is still potential for further decline, as indicated by the Relative Strength Index (RSI), which is neutral but leaning bearish at about 40. This indicates waning market participation and that buyers are not yet prepared to defend higher levels, especially when combined with dwindling trading volume.
Not only does the $3,500 level have historical significance but it also aligns with the 200-day moving average, a long-term trend indicator that frequently determines whether an asset is still in a macro uptrend, making it the next important line of defense. Ethereum may use this level as a launching pad for a recovery back toward the $3,900-$4,000 range if it can hold.
In the medium term, though, a clear breakdown below $3,500 might hasten losses toward $3,200 or even $3,000, indicating a possible trend reversal for Ethereum. Ethereum’s course is currently obvious, as the price is moving in the direction of its most dependable support level.
In the days ahead, it will become clear if bulls can defend at $3,500 or if ETH’s present weakness develops into a more significant correction.
Disclaimer: The content of this article solely reflects the author's opinion and does not represent the platform in any capacity. This article is not intended to serve as a reference for making investment decisions.
You may also like
Crypto projects spend $1.4 billion on token buybacks in 2025
Ethereum Foundation sets per-transaction gas limit for Fusaka upgrade

10x Growth in 4 Months! Leading Market Prediction Platform Polymarket Seeks Funding at $15 Billion Valuation
In June of this year, Polymarket completed a funding round at a valuation of $1 billion. Just four months later, its valuation target has soared to a range of $12 billion to $15 billion.

ERC-8004: The Rise of Digital Assets and the Machine Economy
In the wave of AI and blockchain integration, the release of ERC-8004 marks the entry of the Machine Economy into the Trust Era.