Date: Mon, Nov 10, 2025 | 11:30 AM GMT
The cryptocurrency market continues to show strong performance as Ethereum (ETH) jumps more than 5 percent today, lifting several major altcoins into positive momentum — including Hedera (HBAR).
HBAR is up by an impressive 14 percent over the last 24 hours, and more importantly, its chart is beginning to reflect the same bullish fractal that previously triggered a powerful breakout rally.
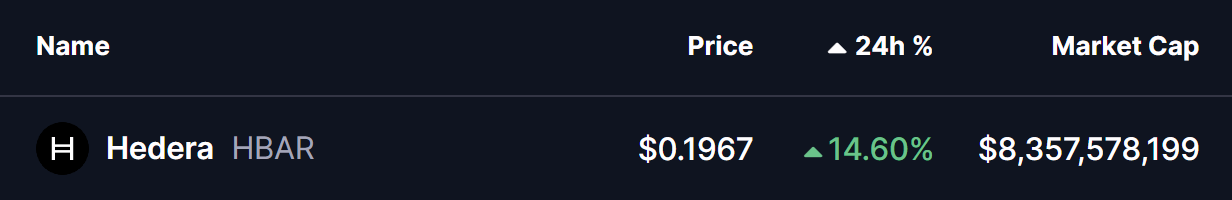 Source: Coinmarketcap
Fractal Setup Hints at a Bullish Breakout
The daily chart of HBAR is showing early signs of a repeated bullish structure built around three core elements: a long accumulation zone, a falling wedge correction, and the potential reclaim of the 100-day moving average.
Earlier this year, HBAR formed a similar pattern in July. Price corrected inside a falling wedge while holding strong support near the $0.13 accumulation range. After weeks of compression, the token broke out of the wedge and reclaimed the 100-day moving average, which triggered a strong 94 percent rally toward the ascending resistance trendline.
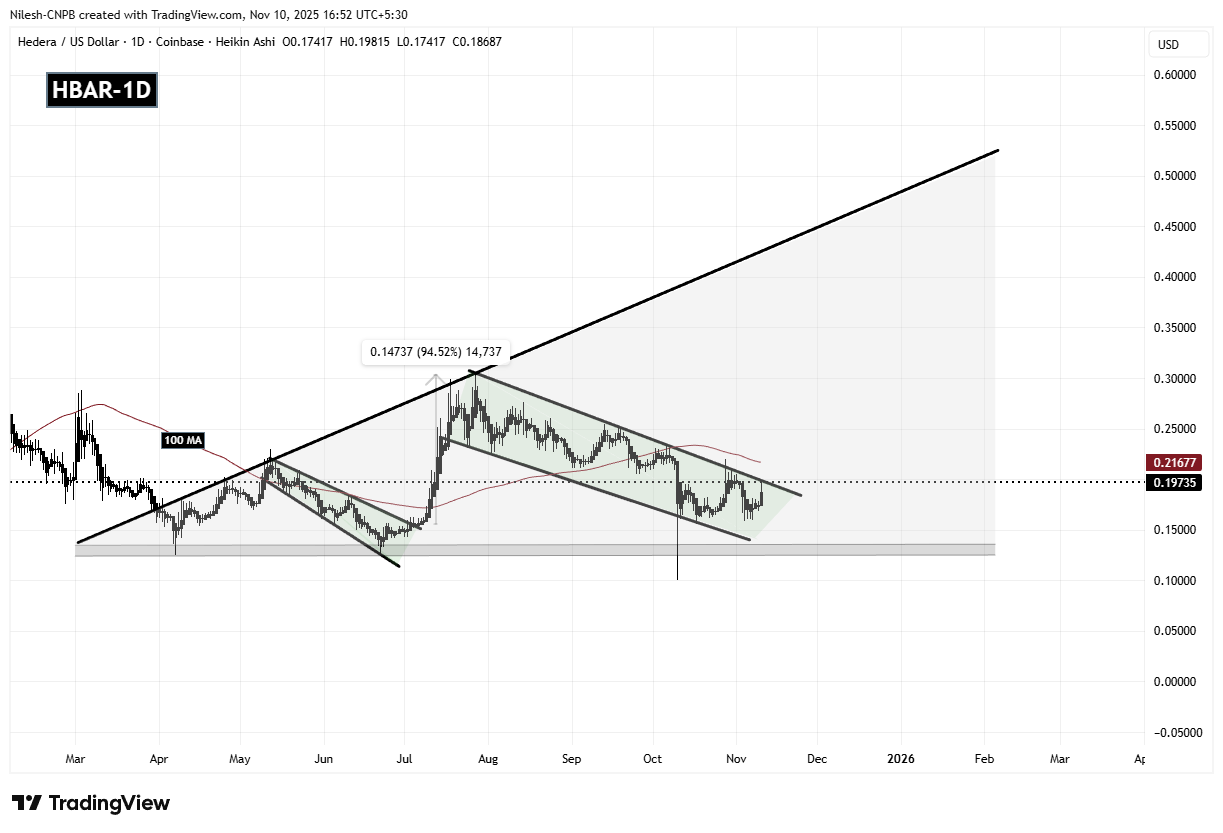 Hedera (HBAR) Daily Chart/Coinsprobe (Source: Tradingview)
Now, the same structure appears to be unfolding again.
HBAR has once again bounced from its multi-month accumulation zone and is now pushing against the upper boundary of the current falling wedge near $0.1973. The token is also positioned just below the 100-day MA at $0.2167. This is the same alignment that preceded the earlier breakout, hinting that bullish momentum may be building quietly beneath the surface.
What’s Next for HBAR?
For this fractal setup to remain valid, HBAR must break above the wedge resistance and reclaim the 100-day moving average. If buyers succeed, the next key technical target lies near $0.3483, which represents a potential 77 percent rise from current levels.
Beyond that, the long-term ascending resistance trendline leaves room for even larger expansion later in the cycle if momentum strengthens, just as it did during the previous fractal.
For now, confirmation is crucial. A reclaim of the 100-day MA would be the clearest sign that the bullish structure is active and that a continuation rally may be underway.