XRP Moving Above 'Cloud' Resistance is Bullish for Bitcoin: Analyst

We view XRP's breakout above the Ichimoku cloud as a good example for bitcoin, Fairlead's Katie Stockton said.
Payments-focused XRP has set a bullish precedent for market leader bitcoin (BTC) with a move above key price resistance that has opened doors for a sustained rally.
XRP surged nearly 60% last week, registering its best performance since August 2021. The rally saw prices move convincingly above a technical analysis indicator called "Ichimoku cloud" on the weekly chart, confirming a bullish breakout.
Bitcoin (BTC) is yet to achieve that feat.
"We view [XRP's] cloud breakout as a good example for bitcoin," founder and managing partner at Fairlead Strategies said in a note to clients.
The Ichimoku Cloud, a technical analysis indicator created by Japanese journalist Goichi Hosoda in the late 1960s, is widely used by traders and analysts to identify support and resistance levels and gauge trend changes. The indicator comprises five lines based on the price's moving averages: Leading Span A, Leading Span B, Conversion Line or Tenkan-Sen (T), Base Line or Kijun-Sen (K) and a lagging closing price line. The spread between the Leading Span A and the leading Span B represents the cloud.
Crossovers above or below the cloud are widely taken to represent bullish or bearish trend change.

XRP has established a foothold above the Ichimoku cloud, while bitcoin remains locked in a narrow range below the cloud resistance (upper end).The token's breakout follows a year-long consolidation or basing pattern and suggests more gains ahead.
"The move is meaningful on the chart because it resolves a year-long basing process higher. Intermediate-term momentum is positive and there are (surprisingly) no signs of upside exhaustion, supporting upside follow-through, with next resistance near $0.92," Stockton noted.
A similar bullish outlook awaits bitcoin on the higher side of the Ichimoku cloud, with the next resistance level at $31,900.
At press time, XRP changed hands at 83 cents, while bitcoin traded near $30,000.
Edited by Parikshit Mishra.
Disclaimer: The content of this article solely reflects the author's opinion and does not represent the platform in any capacity. This article is not intended to serve as a reference for making investment decisions.
You may also like
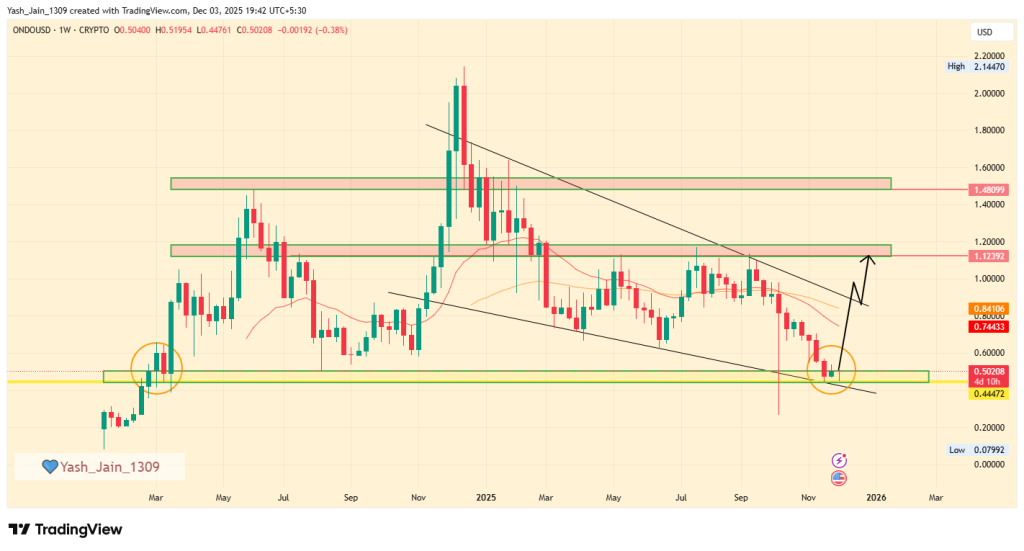
ONDO Price Eyes 120% December Rally as Falling Wedge Pattern Strengthens
Crypto News Today: SEC Stops ProShares From Launching XRP and Other Leveraged Crypto ETFs
Bitcoin Leverage Liquidation and Potential Dangers of Excessive Exposure in 2025
- 2025 crypto market saw $1B+ leveraged liquidations as Bitcoin fell from $126k to $92k amid Fed policy uncertainty and geopolitical tensions. - Retail traders suffered disproportionately from 10x-20x leverage during price corrections, while institutions used ETFs and hedging to mitigate risks. - Derivatives market vulnerabilities exposed include liquidity crunches, algorithmic feedback loops, and cross-market contagion risks via crypto-treasury overlaps. - Post-2025 lessons emphasize 3x-5x leverage caps,

The Recent Fluctuations in the Solana Network and What They Mean for Blockchain Investors
- Solana's 2025 volatility highlights risks for blockchain investors from market psychology and infrastructure flaws. - November 2025 saw 6.1% price drops driven by leverage, Fed rate uncertainty, and plummeting on-chain activity metrics. - $3.1B in DeFi losses from smart contract exploits and AWS outage risks exposed technical vulnerabilities despite decentralization gains. - Investors must balance sentiment indicators (fear/greed index) with technical metrics (TVL, DEX volume) to navigate Solana's instab