
Bitcoin Price Signals Recovery But The Bears Are Not Out of Woods Yet
Bitcoin price is still struggling below the $43,500 resistance zone. BTC could start a recovery wave if there is a clear move above the $44,000 resistance zone.
- Bitcoin price started a consolidation phase from the $41,500 zone.
- The price is trading above $42,500 and the 100 hourly Simple moving average.
- There is a key rising channel forming with resistance near $44,000 on the hourly chart of the BTC/USD pair (data feed from Kraken).
- The pair could start a decent recovery wave if there is a move above the $44,000 resistance zone.
Bitcoin Price Faces Hurdles
Bitcoin price found support near the $41,500 zone and recently started a consolidation phase. BTC was able to recover a few points above the $42,000 and $42,200 levels.
The price even spiked above the 23.6% Fib retracement level of the main decline from the $49,000 swing high to the $41,475 low. There is also a key rising channel forming with resistance near $44,000 on the hourly chart of the BTC/USD pair.
Bitcoin is now trading above $42,500 and the 100 hourly Simple moving average . If the bulls remain in action, the price might recover above the $43,250 resistance. The first major resistance is $44,000 or the channel trend line.
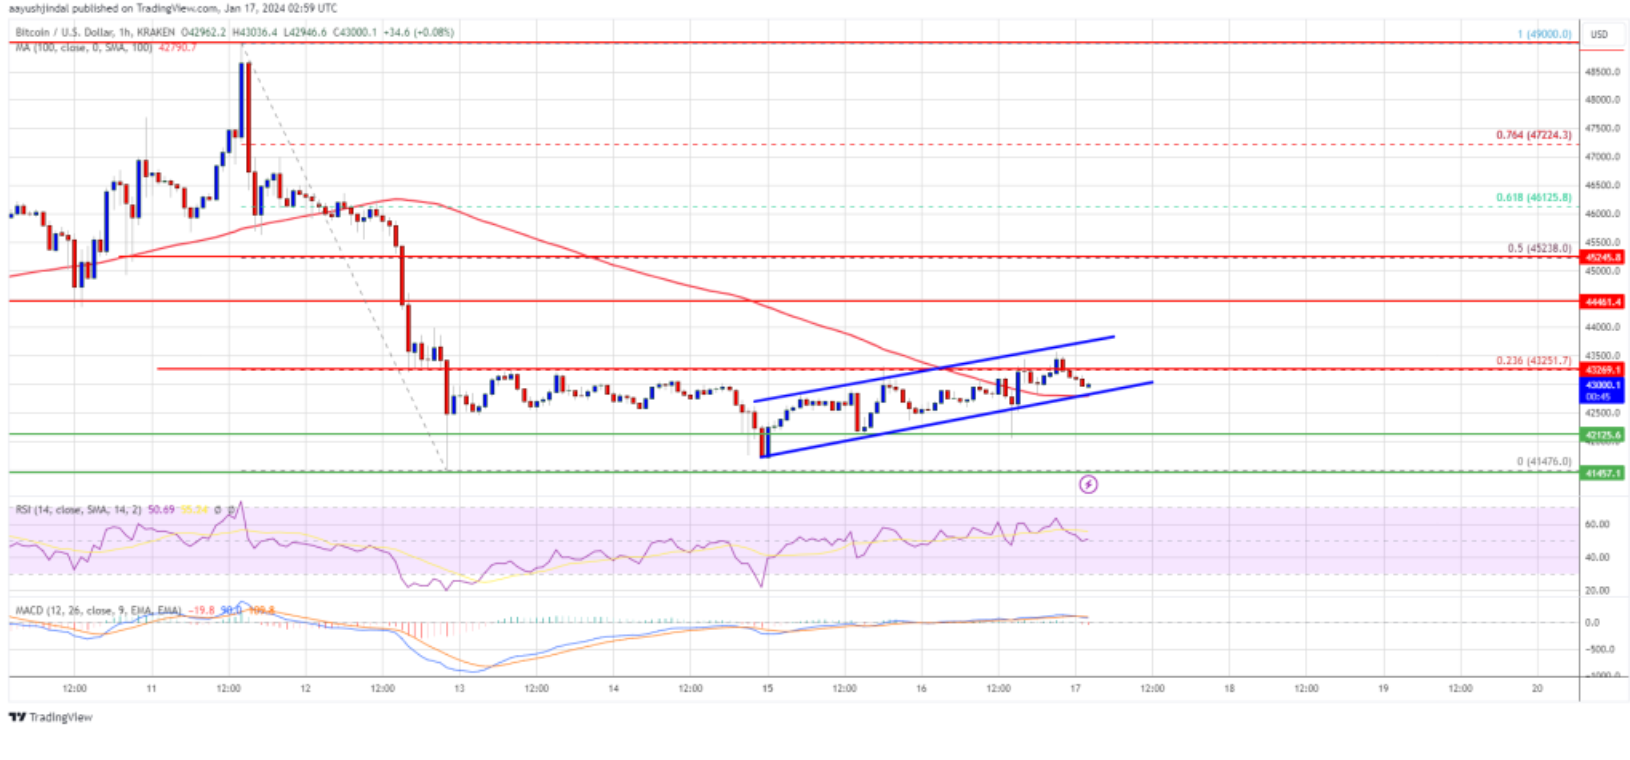
Source: BTCUSD on TradingView.com
A clear move above the $44,000 resistance could send the price toward the $44,450 resistance. The next resistance is now forming near the $45,250 level. It is near the 50% Fib retracement level of the main decline from the $49,000 swing high to the $41,475 low. A close above the $45,250 level could push the price further higher. The next major resistance sits at $47,000.
Another Decline In BTC?
If Bitcoin fails to rise above the $44,000 resistance zone, it could start a fresh decline. Immediate support on the downside is near the $42,800 level or the 100 hourly Simple moving average.
The next major support is $42,120. If there is a close below $42,120, the price could gain bearish momentum. In the stated case, the price could drop toward the $41,500 support in the near term.
Technical indicators:
Hourly MACD – The MACD is now losing pace in the bearish zone.
Hourly RSI (Relative Strength Index) – The RSI for BTC/USD is now above the 50 level.
Major Support Levels – $42,800, followed by $42,120.
Major Resistance Levels – $43,250, $44,000, and $44,450.
Disclaimer: The content of this article solely reflects the author's opinion and does not represent the platform in any capacity. This article is not intended to serve as a reference for making investment decisions.
You may also like
Witness the Dynamic Shifts in Bitcoin and Altcoin ETFs
In Brief Bitcoin and altcoin ETFs witness dynamic shifts in inflows and outflows. XRP and Solana ETFs attract notable investor attention and activity. Institutions explore diversified crypto ETFs for strategic risk management.

Peter Schiff Clashes With President Trump as Economic and Crypto Debates Intensify

Bitcoin Cash Jumps 40% and Establishes Itself as the Best-Performing L1 Blockchain of the Year

Bitcoin Price Plummets: Key Reasons Behind the Sudden Drop Below $88,000