Bitcoin Price Could See “Liftoff” if It’s Able to Hold One Crucial Level
Bitcoin price is attempting a fresh increase from the $42,000 support. BTC could gain bullish momentum if it clears the $43,300 resistance zone.
- Bitcoin price is attempting a fresh increase above the $42,750 resistance zone.
- The price is trading above $42,800 and the 100 hourly Simple moving average.
- There is a short-term rising channel forming with support near $42,950 on the hourly chart of the BTC/USD pair (data feed from Bitget).
- The pair could continue to rise unless there is a close below the $42,350 support zone.
Bitcoin Price Remains Supported
Bitcoin price formed a base above the $42,000 level and started a steady increase. BTC was able to climb above the $42,200 and $42,500 resistance levels.
There was a move above the 50% Fib retracement level of the downward wave from the $43,740 swing high to the $41,888 low. The bulls were able push the price above the $43,000 resistance. There is now a short-term rising channel forming with support near $42,950 on the hourly chart of the BTC/USD pair.
Bitcoin is now trading above $42,800 and the 100 hourly Simple moving average . Immediate resistance is near the $43,300 level. It is near the 76.4% Fib retracement level of the downward wave from the $43,740 swing high to the $41,888 low.
The next key resistance could be $43,750, above which the price could start a decent increase. The next stop for the bulls may perhaps be $44,000.
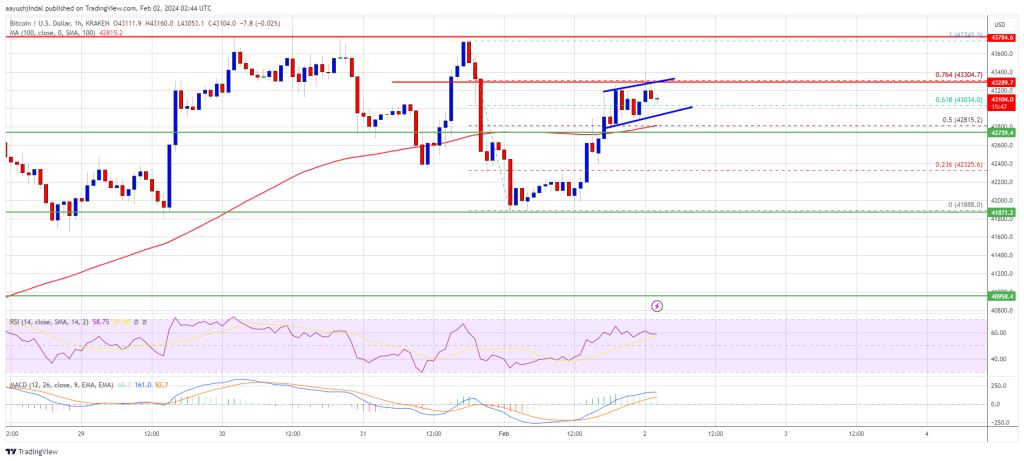
Source: BTCUSD on TradingView.com
A clear move above the $44,000 resistance could send the price toward the $44,200 resistance. The next resistance is now forming near the $44,500 level. A close above the $44,500 level could push the price further higher. The next major resistance sits at $45,000.
Another Decline In BTC?
If Bitcoin fails to rise above the $43,300 resistance zone, it could start another decline. Immediate support on the downside is near the $43,000 level and the channel trend line.
The first major support is $42,800 and the 100 hourly SMA. The main support could be $42,350. If there is a close below $42,350, the price could gain bearish momentum. In the stated case, the price could dive toward the $41,800 support.
Technical indicators:
Hourly MACD – The MACD is now gaining pace in the bullish zone.
Hourly RSI (Relative Strength Index) – The RSI for BTC/USD is now above the 50 level.
Major Support Levels – $42,800, followed by $42,350.
Major Resistance Levels – $43,300, $43,800, and $44,500.
Disclaimer: The content of this article solely reflects the author's opinion and does not represent the platform in any capacity. This article is not intended to serve as a reference for making investment decisions.
You may also like
Young Bitcoin holders panic sell 148K BTC as analysts call for sub-$90K BTC bottom

Rare Bitcoin futures signal could catch traders off-guard: Is a bottom forming?

XRP traders hope fresh wave of ETF launches will restore the bull trend

Aster announces a $10 million trading competition, combined with Stage 4 airdrop and Rocket Launch incentives, driving multi-layered growth in platform depth and liquidity.
After achieving strong performance in Stage 3, Stage 4 (Harvest) airdrop plan was launched, and the “Double Harvest” trading competition with a total reward of 10 million USD will be introduced on November 17.