Ethereum Price Signals Uptrend Exhaustion But Dips Could Be Attractive
Ethereum price is struggling to clear the $2,550 resistance. ETH could start a downside correction if there is a move below the $2,475 support.
- Ethereum is consolidating gains below the $2,550 resistance zone.
- The price is trading above $2,480 and the 100-hourly Simple Moving Average.
- There was a break below a connecting bullish trend line with support at $2,515 on the hourly chart of ETH/USD (data feed via Kraken).
- The pair could start a fresh increase if it stays above the $2,475 support zone.
Ethereum Price Remains Supported
Ethereum price saw a steady increase after it broke the $2,420 resistance. ETH climbed above $2,450 and $2,500, but it underperformed Bitcoin . Finally, the bears appeared near the $2,550 zone.
A high was formed near $2,536 and the price is now consolidating gains. There was a minor decline below the $2,500 level. There was also a break below a connecting bullish trend line with support at $2,515 on the hourly chart of ETH/USD.
Ethereum is still trading above the 23.6% Fib retracement level of the recent increase from the $2,282 swing low to the $2,536 high. It is also trading above $2,480 and the 100-hourly Simple Moving Average .
If there is a fresh increase, the price could surge above the $2,520 level. On the upside, the first major resistance is near the $2,550 level. The next major resistance is near $2,620, above which the price might rise and test the $2,680 resistance.
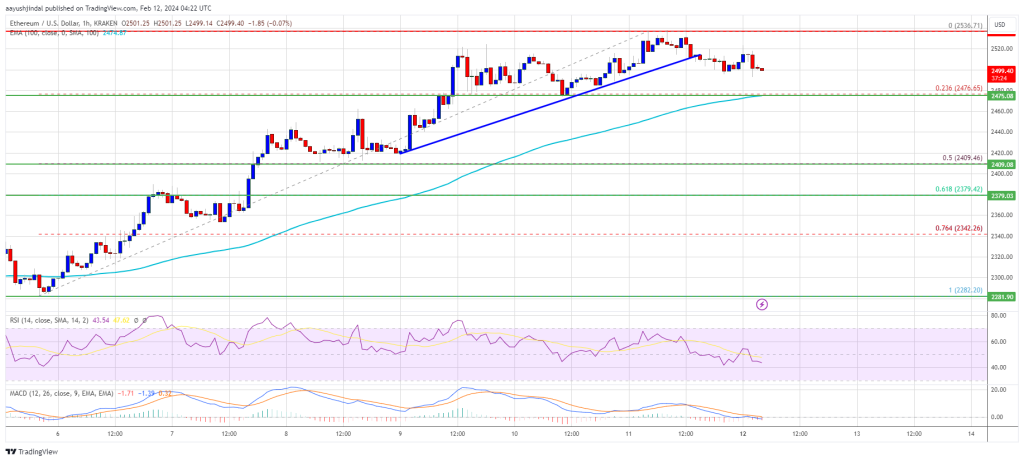
Source: ETHUSD on TradingView.com
If the bulls remain in action, they could even push the price above the $2,750 resistance. In the stated case, the price could rise toward the $2,800 level.
Are Dips Supported In ETH?
If Ethereum fails to clear the $2,550 resistance, it could start a downside correction. Initial support on the downside is near the $2,475 level and the 100 hourly SMA.
The next key support could be the $2,460 zone. A clear move below the $2,460 support might send the price toward $2,400 or the 50% Fib retracement level of the recent increase from the $2,282 swing low to the $2,536 high. The main support could be $2,380. Any more losses might send the price toward the $2,280 level.
Technical Indicators
Hourly MACD – The MACD for ETH/USD is losing momentum in the bullish zone.
Hourly RSI – The RSI for ETH/USD is now above the 50 level.
Major Support Level – $2,475
Major Resistance Level – $2,550
Disclaimer: The content of this article solely reflects the author's opinion and does not represent the platform in any capacity. This article is not intended to serve as a reference for making investment decisions.
You may also like
MiCA regulation poorly applied within the EU, ESMA ready to take back control

$674M Into Solana ETF Despite Market Downturn

Here’s What Could Happen if XRP ETFs Reach $10 Billion
Bitcoin: The Cornerstone of the New Digital Civilization