
ETH Soars 12% Weekly as Bulls Start Looking at $3K (Ethereum Price Analysis)

Ethereum’s price has been rallying aggressively over the past few days. Yet, the market is approaching a strong resistance level that could determine the mid-term fate of ETH.
Technical Analysis
By TradingRage
The Daily Chart
On the daily chart, the price has been rallying since a rebound from the $2,200 zone. The $2,400 resistance level has also been broken with ease.
Currently, ETH is climbing toward the $2,700 resistance level and the higher boundary of the large ascending channel. However, the Relative Strength Index has also been rising, entering the overbought region. This might trigger a possible pullback or reversal as the price reaches the $2,700 resistance level.
The 4-Hour Chart
Looking at the 4-hour chart, the recent rally becomes much more clear. The price is approaching the $2,700 resistance level almost vertically.
This highly bullish momentum is also supported by the Relative Strength Index, which is above the 70% level. Yet, with the RSI being oversold on the daily and the 4-hour charts, the probability of a correction after testing the $2,700 level is significant.
Sentiment Analysis
By TradingRage
Ethereum Funding Rates
Ethereum’s price has been increasing rapidly over the past few weeks. Investors are becoming optimistic once again, expecting the market to make a new all-time high in the coming months. Yet, to gain an insight into potential short-term price developments, it would be beneficial to evaluate futures market sentiment.
This chart presents the Ethereum funding rates. They indicate whether the buyers or the sellers are executing their orders more aggressively on aggregate. Positive values show bullish sentiment, while negative values imply aggregate pessimism by futures traders.
As the chart shows, the price drop a few weeks ago has decreased the funding rates. However, they are once again rising as the price rallies. While being a positive signal, high funding rates are also worrying, as they point to the increased probability of a long-liquidation cascade and, consequently, sudden price drops.
Disclaimer: The content of this article solely reflects the author's opinion and does not represent the platform in any capacity. This article is not intended to serve as a reference for making investment decisions.
You may also like
Harvard Increases IBIT Bitcoin ETF to $443M, Up 257%
Invictus Pharmacy Becomes First U.S. Chain to Accept Crypto for Prescription Payments

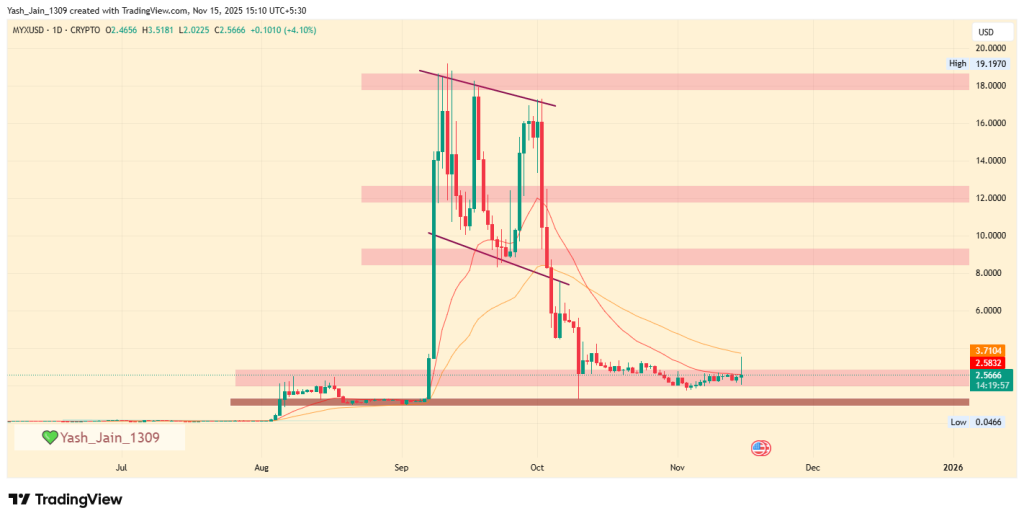
MYX Finance Price Prediction 2025 – 2030: Can MYX Sustain Its Explosive Growth?
“I Will Buy More Bitcoin When the Crash Is Over,” Says Robert Kiyosaki as BTC Price Hits 6-Month Low