
Bitcoin Price Consolidates Above $70K, Can Bulls Pump BTC To $75K?
Bitcoin price is consolidating above the $70,000 resistance zone. BTC might remain in a range for some time before the bulls attempt a move toward $75,000.
- Bitcoin price is struggling to gain pace above the $71,500 resistance zone.
- The price is trading above $70,500 and the 100 hourly Simple moving average.
- There is a short-term rising channel forming with support at $70,750 on the hourly chart of the BTC/USD pair (data feed from Kraken).
- The pair could soon start a fresh rally if it clears the $71,500 resistance zone.
Bitcoin Price Remains In Range
Bitcoin price formed a base above the $69,000 resistance zone. BTC climbed higher the $70,000 resistance zone to move again into a positive zone.
The price broke the $71,000 level but the bears were active below the $71,500 resistance. The recent high was formed near $71,306 and the price is now consolidating gains. It is trading near the 23.6% Fib retracement level of the upward move from the $69,128 swing low to the $71,306 high.
Bitcoin is now trading above $70,500 and the 100 hourly Simple moving average . There is also a short-term rising channel forming with support at $70,750 on the hourly chart of the BTC/USD pair.
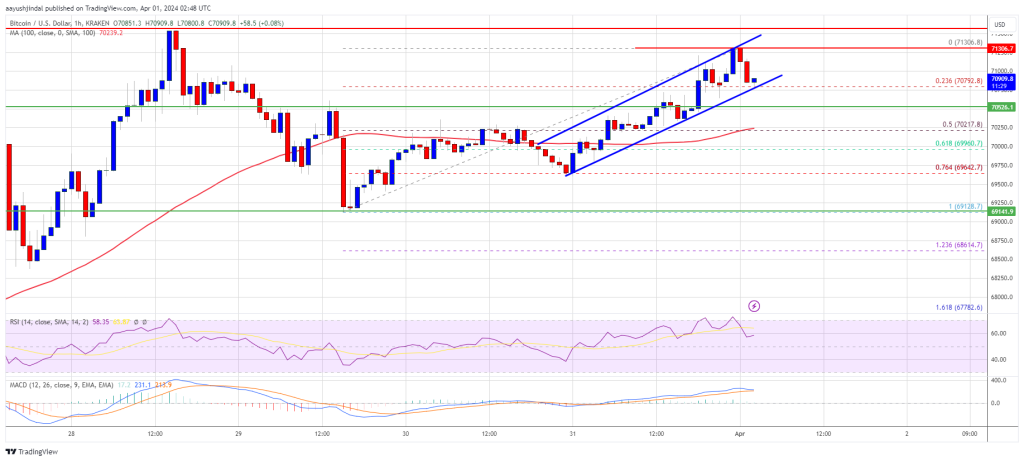
Source: BTCUSD on TradingView.com
Immediate resistance is near the $71,300 level. The first major resistance could be $71,500. If there is a clear move above the $71,500 resistance zone, the price could start a strong increase. In the stated case, the price could even clear the $72,500 resistance zone in the near term. The next major resistance is near the $73,500 zone.
Another Drop In BTC?
If Bitcoin fails to rise above the $71,200 resistance zone, it could start another decline. Immediate support on the downside is near the $70,750 level and the channel trend line.
The first major support is $70,200 and the 50% Fib retracement level of the upward move from the $69,128 swing low to the $71,306 high. The next support sits at $70,000. If there is a close below $70,000, the price could start a drop toward the $69,120 level. Any more losses might send the price toward the $68,500 support zone in the near term.
Technical indicators:
Hourly MACD – The MACD is now losing pace in the bullish zone.
Hourly RSI (Relative Strength Index) – The RSI for BTC/USD is now above the 50 level.
Major Support Levels – $70,750, followed by $70,200.
Major Resistance Levels – $71,200, $71,500, and $73,500.
Disclaimer: The content of this article solely reflects the author's opinion and does not represent the platform in any capacity. This article is not intended to serve as a reference for making investment decisions.
You may also like
Bitcoin Bollinger Bands repeat ‘parabolic’ bull signal from late 2023

Bitcoin adds $732B in new capital this cycle as market structure transforms

[English Long Read] Restaking Track Review: Truths, Misconceptions, and the Unfinished Journey