Bitcoin ( BTC ) could be seeing the final innings of a macro bull run, a historically accurate on-chain metric says.
The value days destroyed (VDD) multiple, which forecast previous BTC price tops, has hit a “rare” high.
VDD multiple hits “rare” high
Bitcoin has so far failed to flip either new all-time highs or its previous peak from 2021 to firm support.
Some remain confident that BTC price discovery will return, but those analyzing on-chain signals are becoming concerned.
Among them is analyst TXMC, host of YouTube channel Alpha Beta Soup.
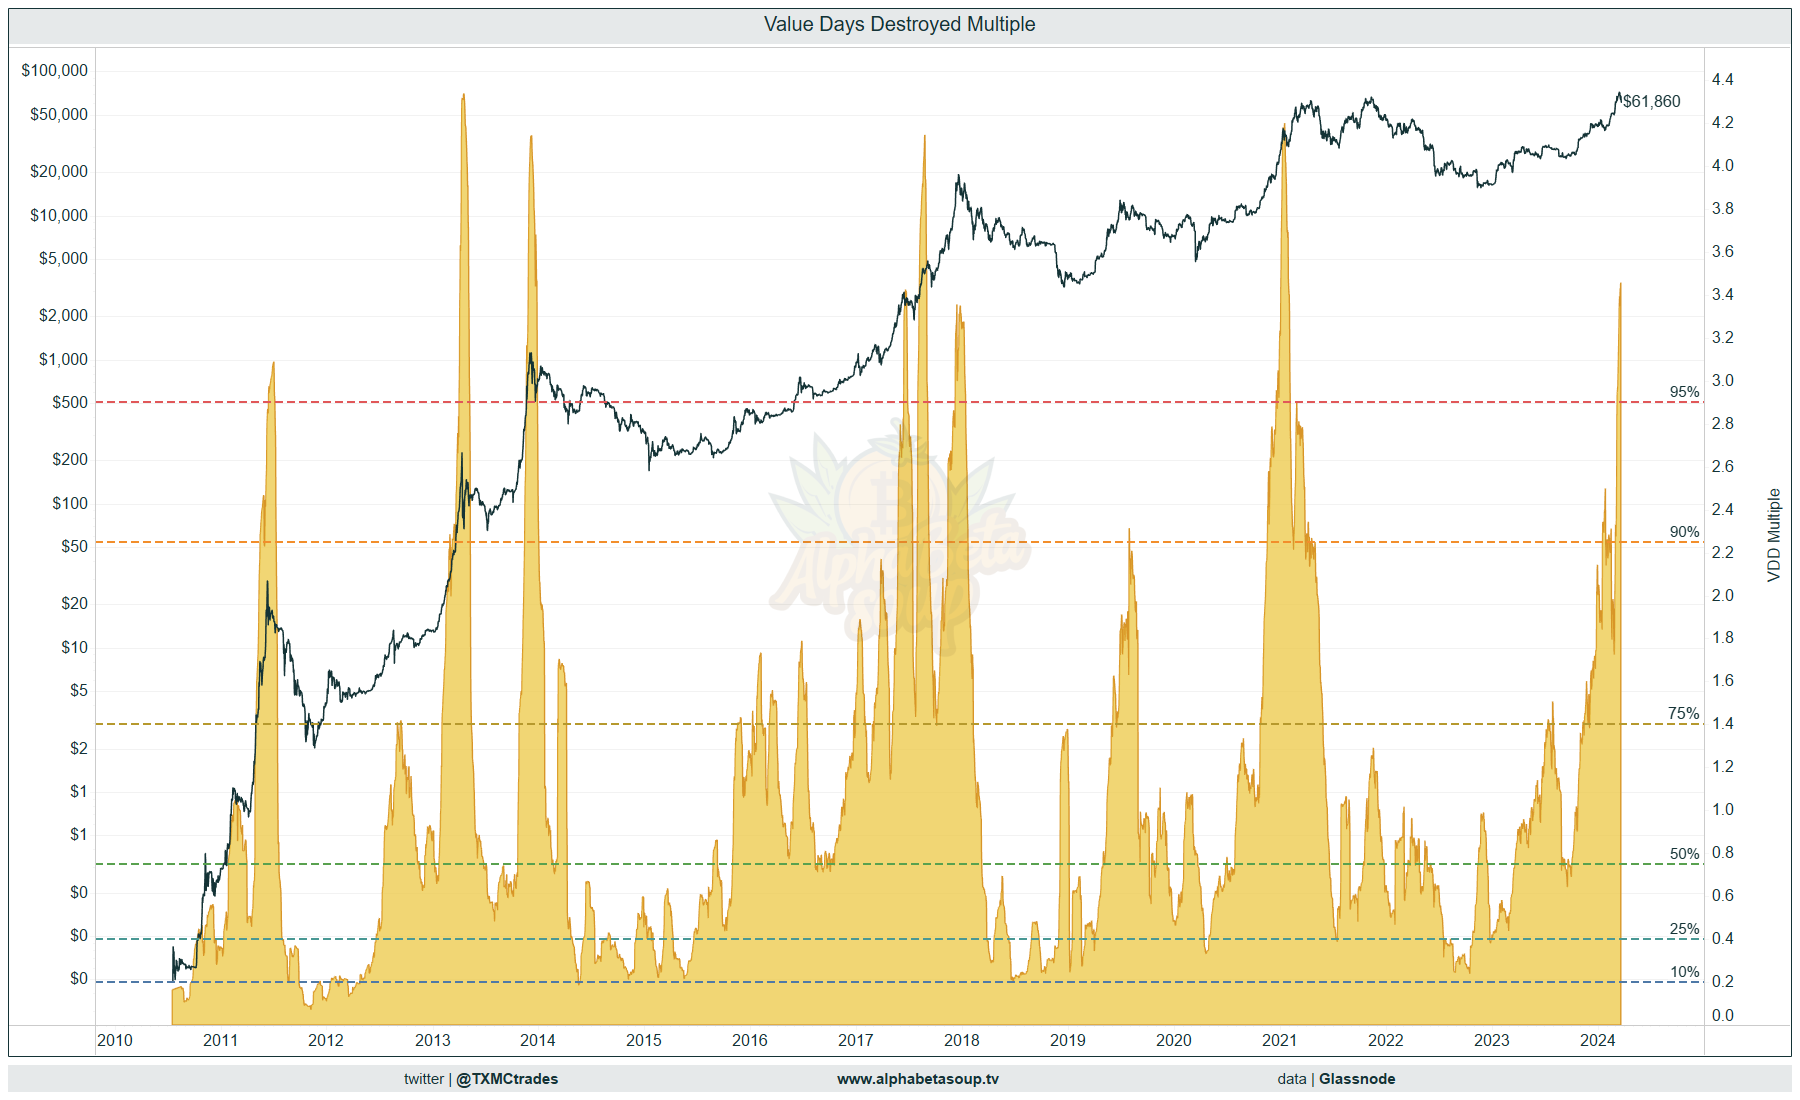
Uploading fresh VDD multiple data to X this week, TXMC revealed that the chart had printed highs seen only shortly before BTC/USD puts in macro tops.
“The rare 4.0 print,” he wrote in accompanying commentary.
“Has on-chain momentum topped?”
Bitcoin VDD multiple. Source: TXMC
The VDD Multiple compares on-chain spending to historical averages to determine when market psychology is dictating a blow-off top for price. The “value days destroyed” component relates to the number of days for which coins were previously dormant when used on-chain.
In March, when the VDD multiple was at around 3.5, TXMC already described it as “overheated.”
“It isn’t perfect, but notable,” he wrote at the time.
This year nonetheless includes a key difference from early 2021. During the VDD multiple’s last spike, BTC/USD had already doubled its prior all-time high of $20,000.
“We are printing the same value in 2024 while still AT the prior all-time high,” TXMC added, concluding that the overall picture was “uncertain.”
RSI preserves key support after flush
As Cointelegraph recently reported , other chart metrics have been giving traders cause for cautious optimism.
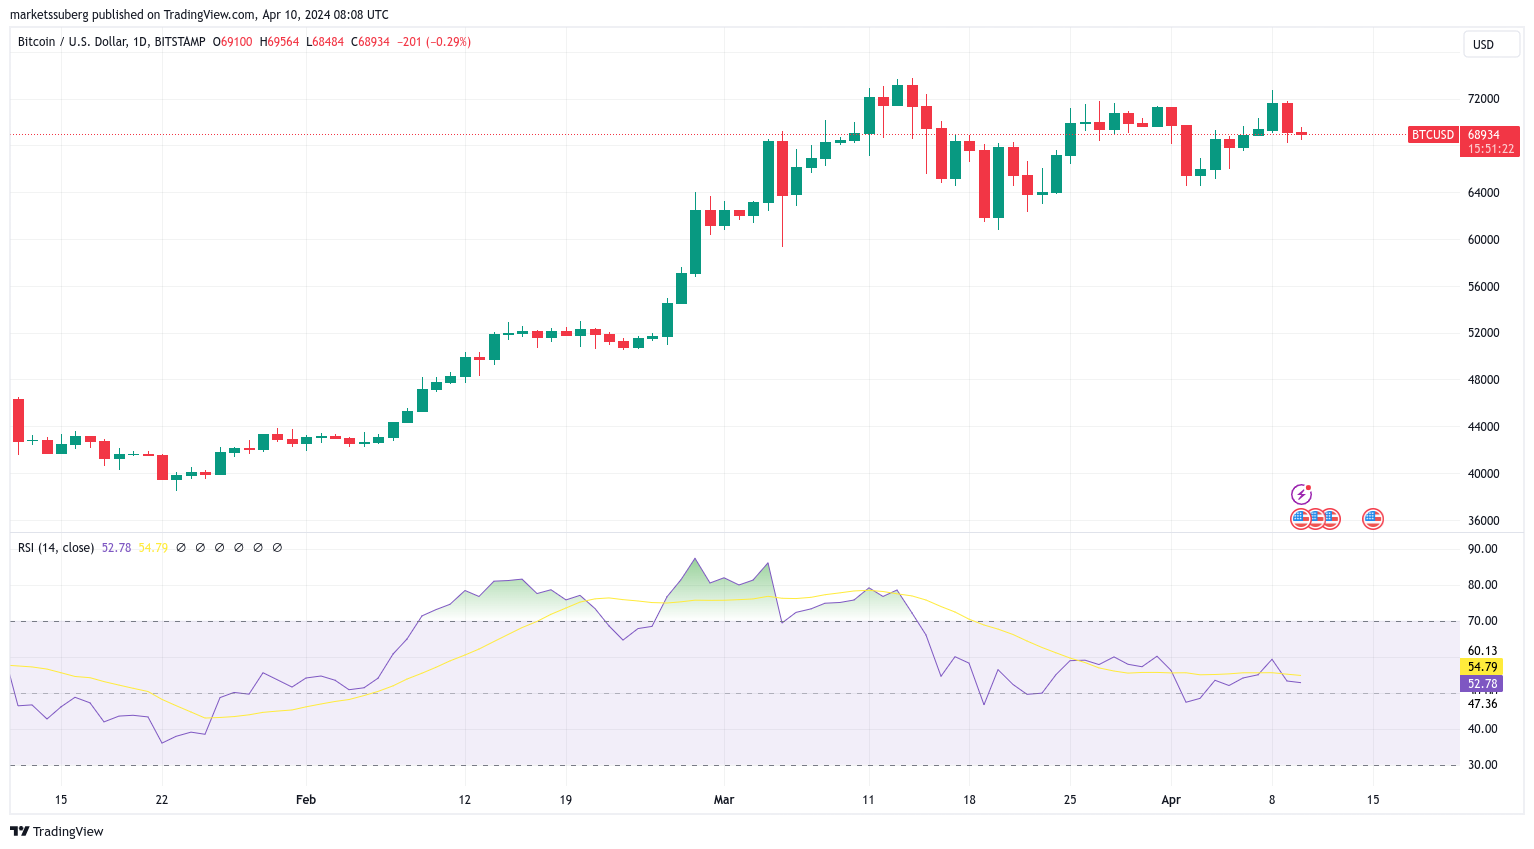
Among them are classic pointers such as the relative strength index (RSI), which recently saw a “reset” to levels that last appeared in late January.
Daily RSI stood at 53 on April 10, per data from Cointelegraph Markets Pro and TradingView — still far below the traditional “overbought” zone, which begins at 70 and tends to accompany the steepest portion of BTC price cycle gains.
BTC/USD 1-day chart with RSI data. Source: TradingView
“In a strong bullish trend, it’s usually time for a bounce when Bitcoin’s daily RSI retests ±50. It’s retesting ±50 right now,” popular traded Jelle noted on the day.
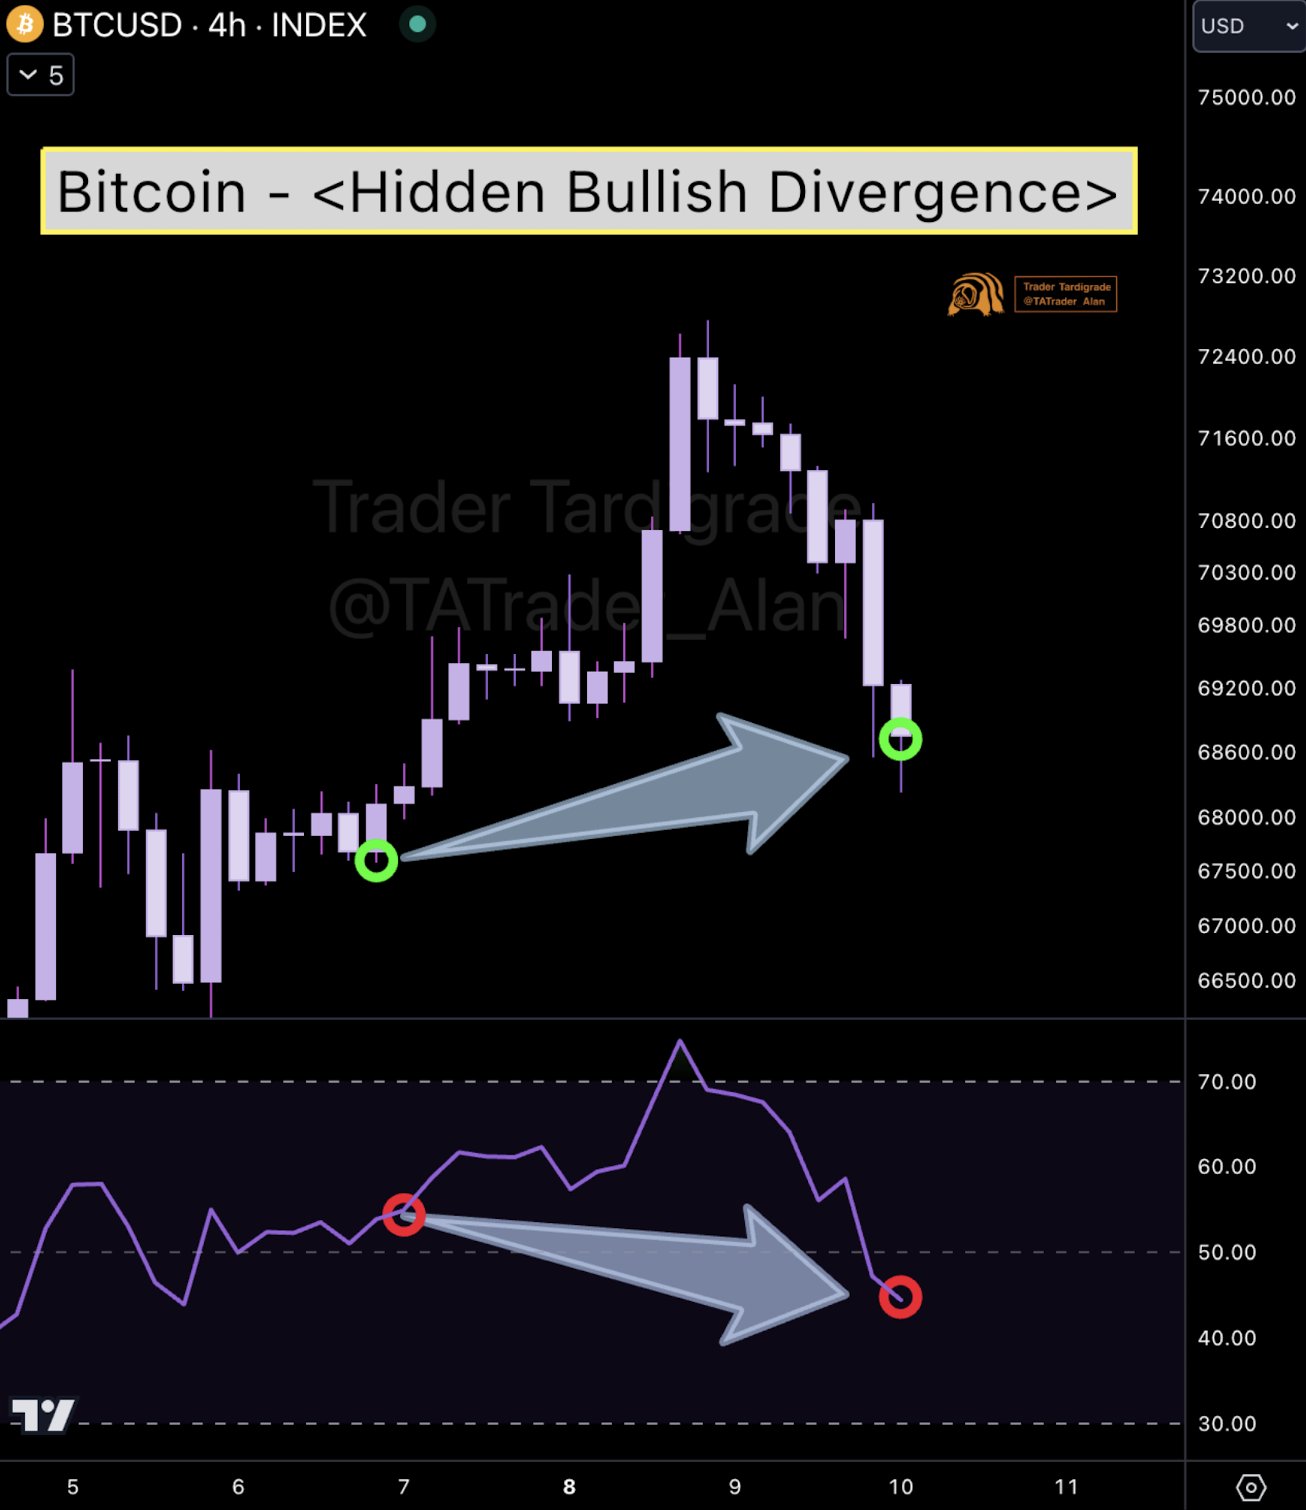
Popular trader Alan Tardigrade reiterated promising signals on 4-hour RSI timeframes in the form of a hidden bullish divergence with price.
"Hidden bullish divergence happens here while $BTC makes a higher low (HL), but RSI is showing a lower low (LL). This signals the possible uptrend continuation," he told X followers alongside a chart.
BTC/USD chart with RSI data. Source: Alan Tardigrade/X
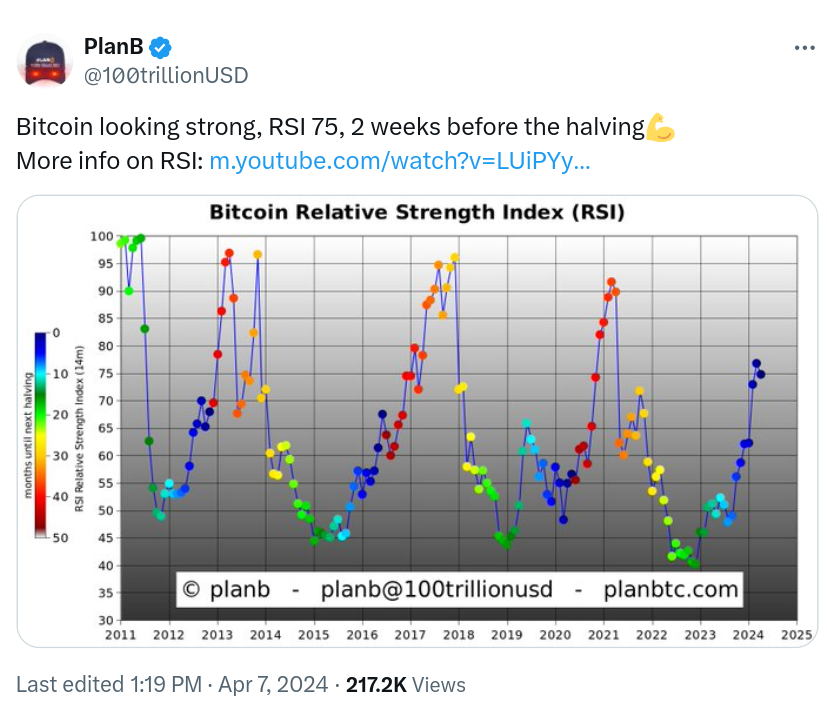
Monthly timeframes continue to hold above 70, a feature on the radar of controversial analyst Plan B and others in advance of Bitcoin’s incoming block subsidy halving .
Source: Plan B
This article does not contain investment advice or recommendations. Every investment and trading move involves risk, and readers should conduct their own research when making a decision.