Ethereum Price Path to Recovery Blocked by Key Barriers

Ethereum price started a recovery wave above the $2,550 zone. ETH is showing positive signs but faces many hurdles near the $2,880 level.
- Ethereum started a decent upward move above the $2,550 zone.
- The price is trading below $2,880 and the 100-hourly Simple Moving Average.
- There is a short-term declining channel forming with resistance at $2,800 on the hourly chart of ETH/USD (data feed via Kraken).
- The pair could start a fresh decline if it stays below the $2,880 level.
Ethereum Price Recovery Faces Hurdles
Ethereum price started a recovery wave after it dropped heavily below $2,500, underperforming Bitcoin . ETH tested the $2,120 zone and recently started a recovery wave.
The price was able to surpass the $2,500 and $2,550 resistance levels. It even climbed above the 50% Fib retracement level of the downward move from the $3,402 swing high to the $2,127 swing low. However, the bears are now active near the $2,900 zone.
The price failed to clear the 61.8% Fib retracement level of the downward move from the $3,402 swing high to the $2,127 swing low. There is also a short-term declining channel forming with resistance at $2,800 on the hourly chart of ETH/USD.
Ethereum price is now trading below $2,880 and the 100-hourly Simple Moving Average. On the upside, the price seems to be facing hurdles near the $2,800 level.
Source: ETHUSD on TradingView.comThe first major resistance is near the $2,880 level. The main resistance is now forming near $2,920. A clear move above the $2,920 resistance might send the price toward the $3,000 resistance. An upside break above the $3,000 resistance might call for more gains in the coming sessions. In the stated case, Ether could rise toward the $3,120 resistance zone or even $3,250 in the near term.
Another Drop In ETH?
If Ethereum fails to clear the $2,880 resistance, it could start another decline. Initial support on the downside is near the $2,640 level. The first major support sits near the $2,550.
A clear move below the $2,550 support might push the price toward the $2,500 support. Any more losses might send the price toward the $2,420 support level in the near term. The next key support sits at $2,350.
Technical Indicators
Hourly MACD – The MACD for ETH/USD is losing momentum in the bullish zone.
Hourly RSI – The RSI for ETH/USD is now below the 50 zone.
Major Support Level – $2,550
Major Resistance Level – $2,880
Disclaimer: The content of this article solely reflects the author's opinion and does not represent the platform in any capacity. This article is not intended to serve as a reference for making investment decisions.
You may also like
‘Most hated bull run ever?’ 5 things to know in Bitcoin this week

Bitcoin price eyes $112K liquidity grab as US government shutdown nears end

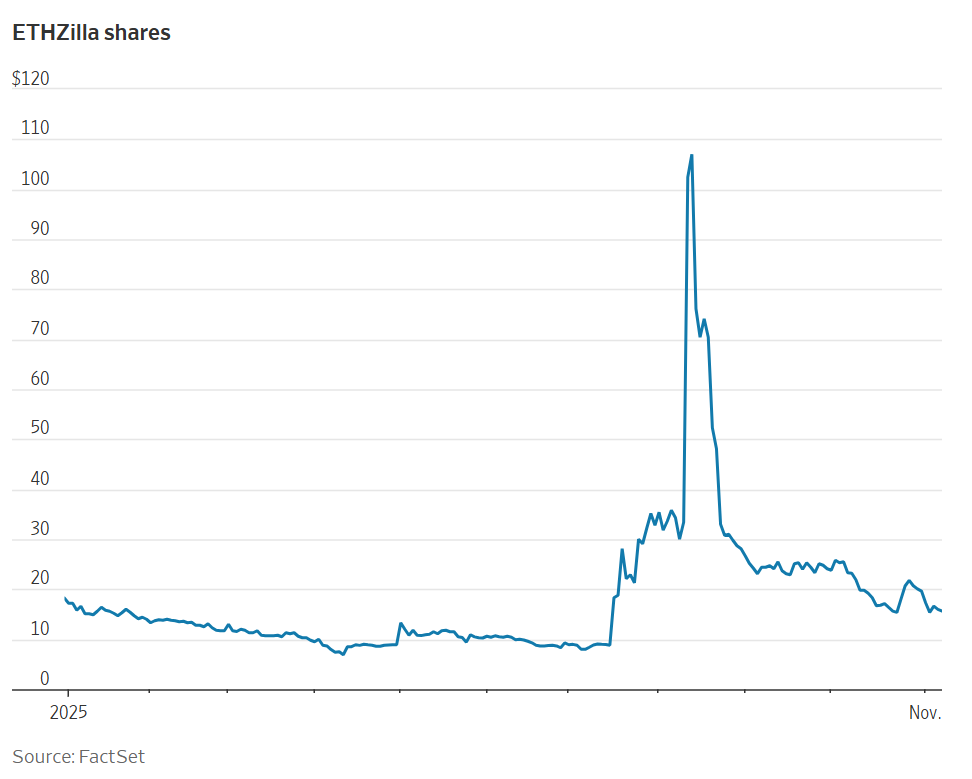
This year's hottest cryptocurrency trade suddenly collapses—should investors cut their losses or buy the dip?
The cryptocurrency boom has cooled rapidly, and the leveraged nature of treasury stocks has amplified losses, causing the market value of the giant whale Strategy to nearly halve. Well-known short sellers have closed out their positions and exited, while some investors are buying the dip.
Showcasing portfolios, following top influencers, one-click copy trading: When investment communities become the new financial infrastructure
The platforms building this layer of infrastructure are creating a permanent market architecture tailored to the way retail investors operate.