Solana (SOL) at a Crossroads: Can It Break Through and Turn Bullish?

Solana started a fresh decline from the $220 zone. SOL price is consolidating and might face resistance near the $215 and $220 levels.
- SOL price started a fresh decline below the $215 and $212 levels against the US Dollar.
- The price is now trading below $212 and the 100-hourly simple moving average.
- There is a short-term declining channel or a bullish flag forming with resistance at $213 on the hourly chart of the SOL/USD pair (data source from Kraken).
- The pair could start a fresh increase if the bulls clear the $220 zone.
Solana Price Faces Resistance
Solana price struggled to clear the $250 resistance and started a fresh decline, like Bitcoin and Ethereum . SOL declined below the $220 and $200 support levels.
It even dived below the $180 level. The recent low was formed at $175 before the price climbed and tested the $220 resistance. A high was formed at $220 and the price is now consolidating. There was a drop below the 23.6% Fib retracement level of the upward move from the $175 swing low to the $220 high.
Solana is now trading below $220 and the 100-hourly simple moving average. On the upside, the price is facing resistance near the $212 level. There is also a short-term declining channel or a bullish flag forming with resistance at $213 on the hourly chart of the SOL/USD pair.
Source: SOLUSD on TradingView.comThe next major resistance is near the $215 level. The main resistance could be $220. A successful close above the $220 resistance zone could set the pace for another steady increase. The next key resistance is $232. Any more gains might send the price toward the $250 level.
Another Decline in SOL?
If SOL fails to rise above the $215 resistance, it could start another decline. Initial support on the downside is near the $202 zone. The first major support is near the $198 level or the 50% Fib retracement level of the upward move from the $175 swing low to the $220 high.
A break below the $198 level might send the price toward the $192 zone. If there is a close below the $192 support, the price could decline toward the $175 support in the near term.
Technical Indicators
Hourly MACD – The MACD for SOL/USD is losing pace in the bullish zone.
Hourly Hours RSI (Relative Strength Index) – The RSI for SOL/USD is below the 50 level.
Major Support Levels – $202 and $198.
Major Resistance Levels – $215 and $220.
Disclaimer: The content of this article solely reflects the author's opinion and does not represent the platform in any capacity. This article is not intended to serve as a reference for making investment decisions.
You may also like
Kodiak launches Berachain native perpetual contract platform—Kodiak Perps, enhancing its liquidity ecosystem
The native liquidity platform of the Berachain ecosystem, Kodiak, recently launched a new product, Kodiak Perps,...

Mars Morning News | Michael Saylor calls: Buy Bitcoin now
Trump Media & Technology Group’s Q3 losses widened to $54.8 million, and it holds substantial amounts of bitcoin and CRO tokens; US consumer confidence has fallen to a historic low; a whale bought the dip in ZEC and made a profit; a bitcoin whale transferred assets; Michael Saylor called for buying bitcoin; the Federal Reserve may initiate bond purchases. Summary generated by Mars AI. The accuracy and completeness of this content is still being iteratively updated by the Mars AI model.

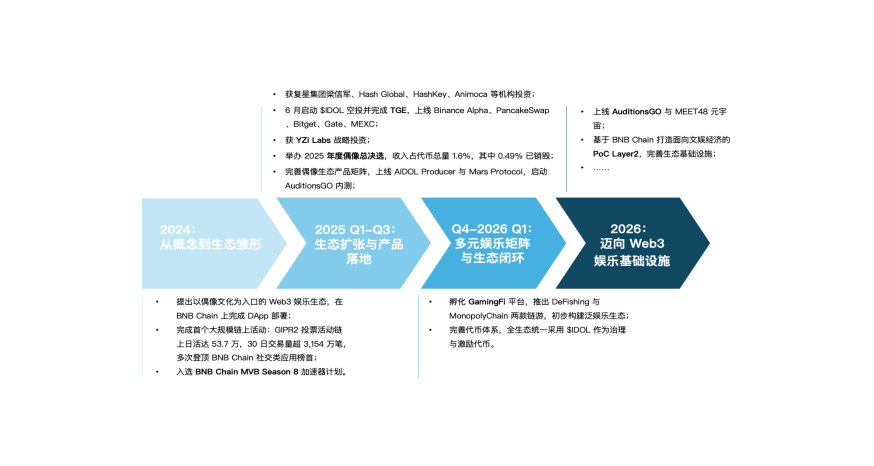
MEET48: From Star-Making Factory to On-Chain Netflix — How AIUGC and Web3 Are Reshaping the Entertainment Economy
Web3 entertainment is moving from the retreat of the bubble to a moment of restart. Projects represented by MEET48 are reshaping content production and value distribution paradigms through the integration of AI, Web3, and UGC technologies. They are building sustainable token economies, evolving from applications to infrastructure, aiming to become the "Netflix on-chain" and driving large-scale adoption of Web3 entertainment.
Digital Euro: Italy Advocates for a Gradual Implementation