- Bitcoin’s consolidation near key support mirrors past patterns, hinting at a potential breakout if history repeats.
- Market structure analysis suggests Bitcoin could rebound from support, signaling an upward move similar to previous cycles.
- Strong buying activity at lower levels indicates accumulation, reinforcing optimism for a possible rally toward new highs.
Bitcoin tests key support as traders anticipate the next major move. Doctor Profit highlights an ongoing market structure similar to a past bullish breakout. The price action suggests a potential rally if historical patterns hold.
Bitcoin Holds Support in Consolidation Phase
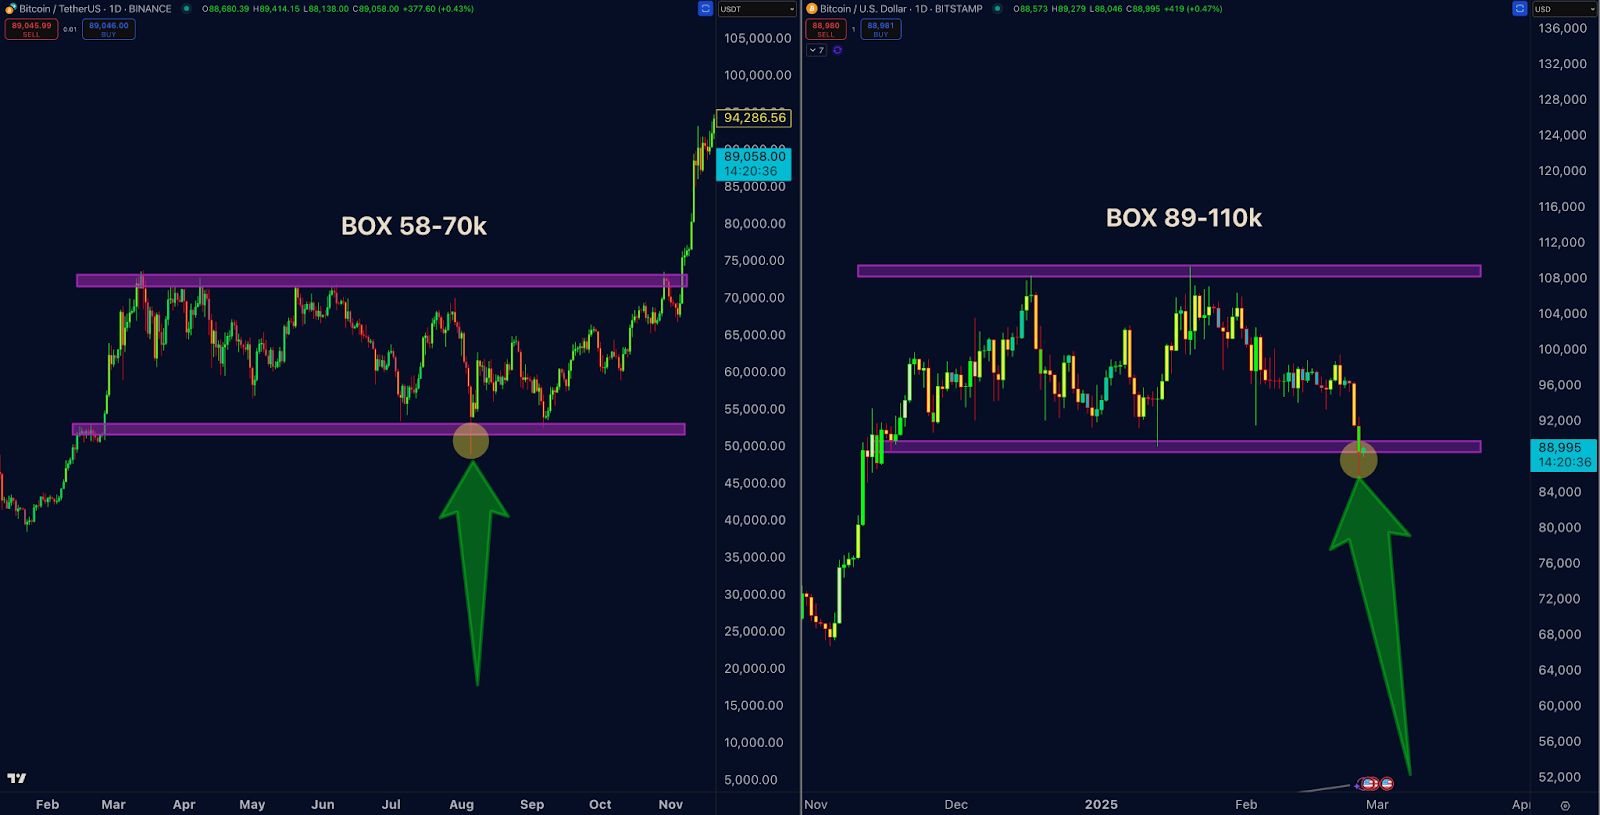
Bitcoin’s price action shows similarities to a past consolidation phase before a breakout. The previous range, between $58,000 and $70,000, saw a prolonged sideways movement before breaking resistance. The trend shift was confirmed by a strong support test that came before the breakout.
 Source: Doctor Profit
Bitcoin is currently trading in the $89,000–$110,000 range, which is consistent with previous price trends. The lower boundary is undergoing tests, reflecting a familiar pattern. If Bitcoin follows the previous cycle, a rebound from support could trigger another breakout.
Market Structure and Historical Comparison
Both charts presented by Doctor Profit illustrate structured price zones. The left chart confirms Bitcoin’s ability to consolidate before an upward movement. The right chart, still within its range, hints at a similar setup.
A key takeaway is Bitcoin’s cyclical behavior. It consolidates within defined boundaries before breaking higher. The green arrows in both charts mark a bounce from support, reinforcing the importance of these levels. Market participants closely monitor this pattern, expecting a breakout once support holds.
Technical Indicators Support Bullish Outlook
Besides historical comparisons, current indicators favor a potential rally. The price remains within the boxed region, suggesting ongoing accumulation. Market sentiment remains cautiously optimistic , with traders watching for confirmation.
Additionally, strong buying activity near the lower boundary signals investor confidence. The current phase aligns with previous accumulation stages before major price surges. A breakout above the resistance could validate the pattern and push Bitcoin toward new highs.
DISCLAIMER: The information on this website is provided as general market commentary and does not constitute investment advice. We encourage you to do your own research before investing.