Hedera (HBAR) Bears Tighten Grip as Price Sinks 52% from Year-To-Date High

HBAR bears tighten their grip as the price drops 52% from YTD high. Key indicators signal further downside, with $0.16 support in focus
The price of Hedera’s HBAR has been on a downtrend since reaching its year-to-date (YTD) high of $0.40 on January 17. The altcoin has now dropped to $0.19, marking a 52% decline as bearish pressure continues to dominate the market.
Technical indicators suggest the downturn may not be over, as selling pressure remains high.
HBAR’s Price Woes Continue as Indicators Show No Relief
The sustained dip in HBAR’s Relative Strength Index (RSI) confirms the surging selling pressure among its spot traders. As of this writing, this is at 40.62.
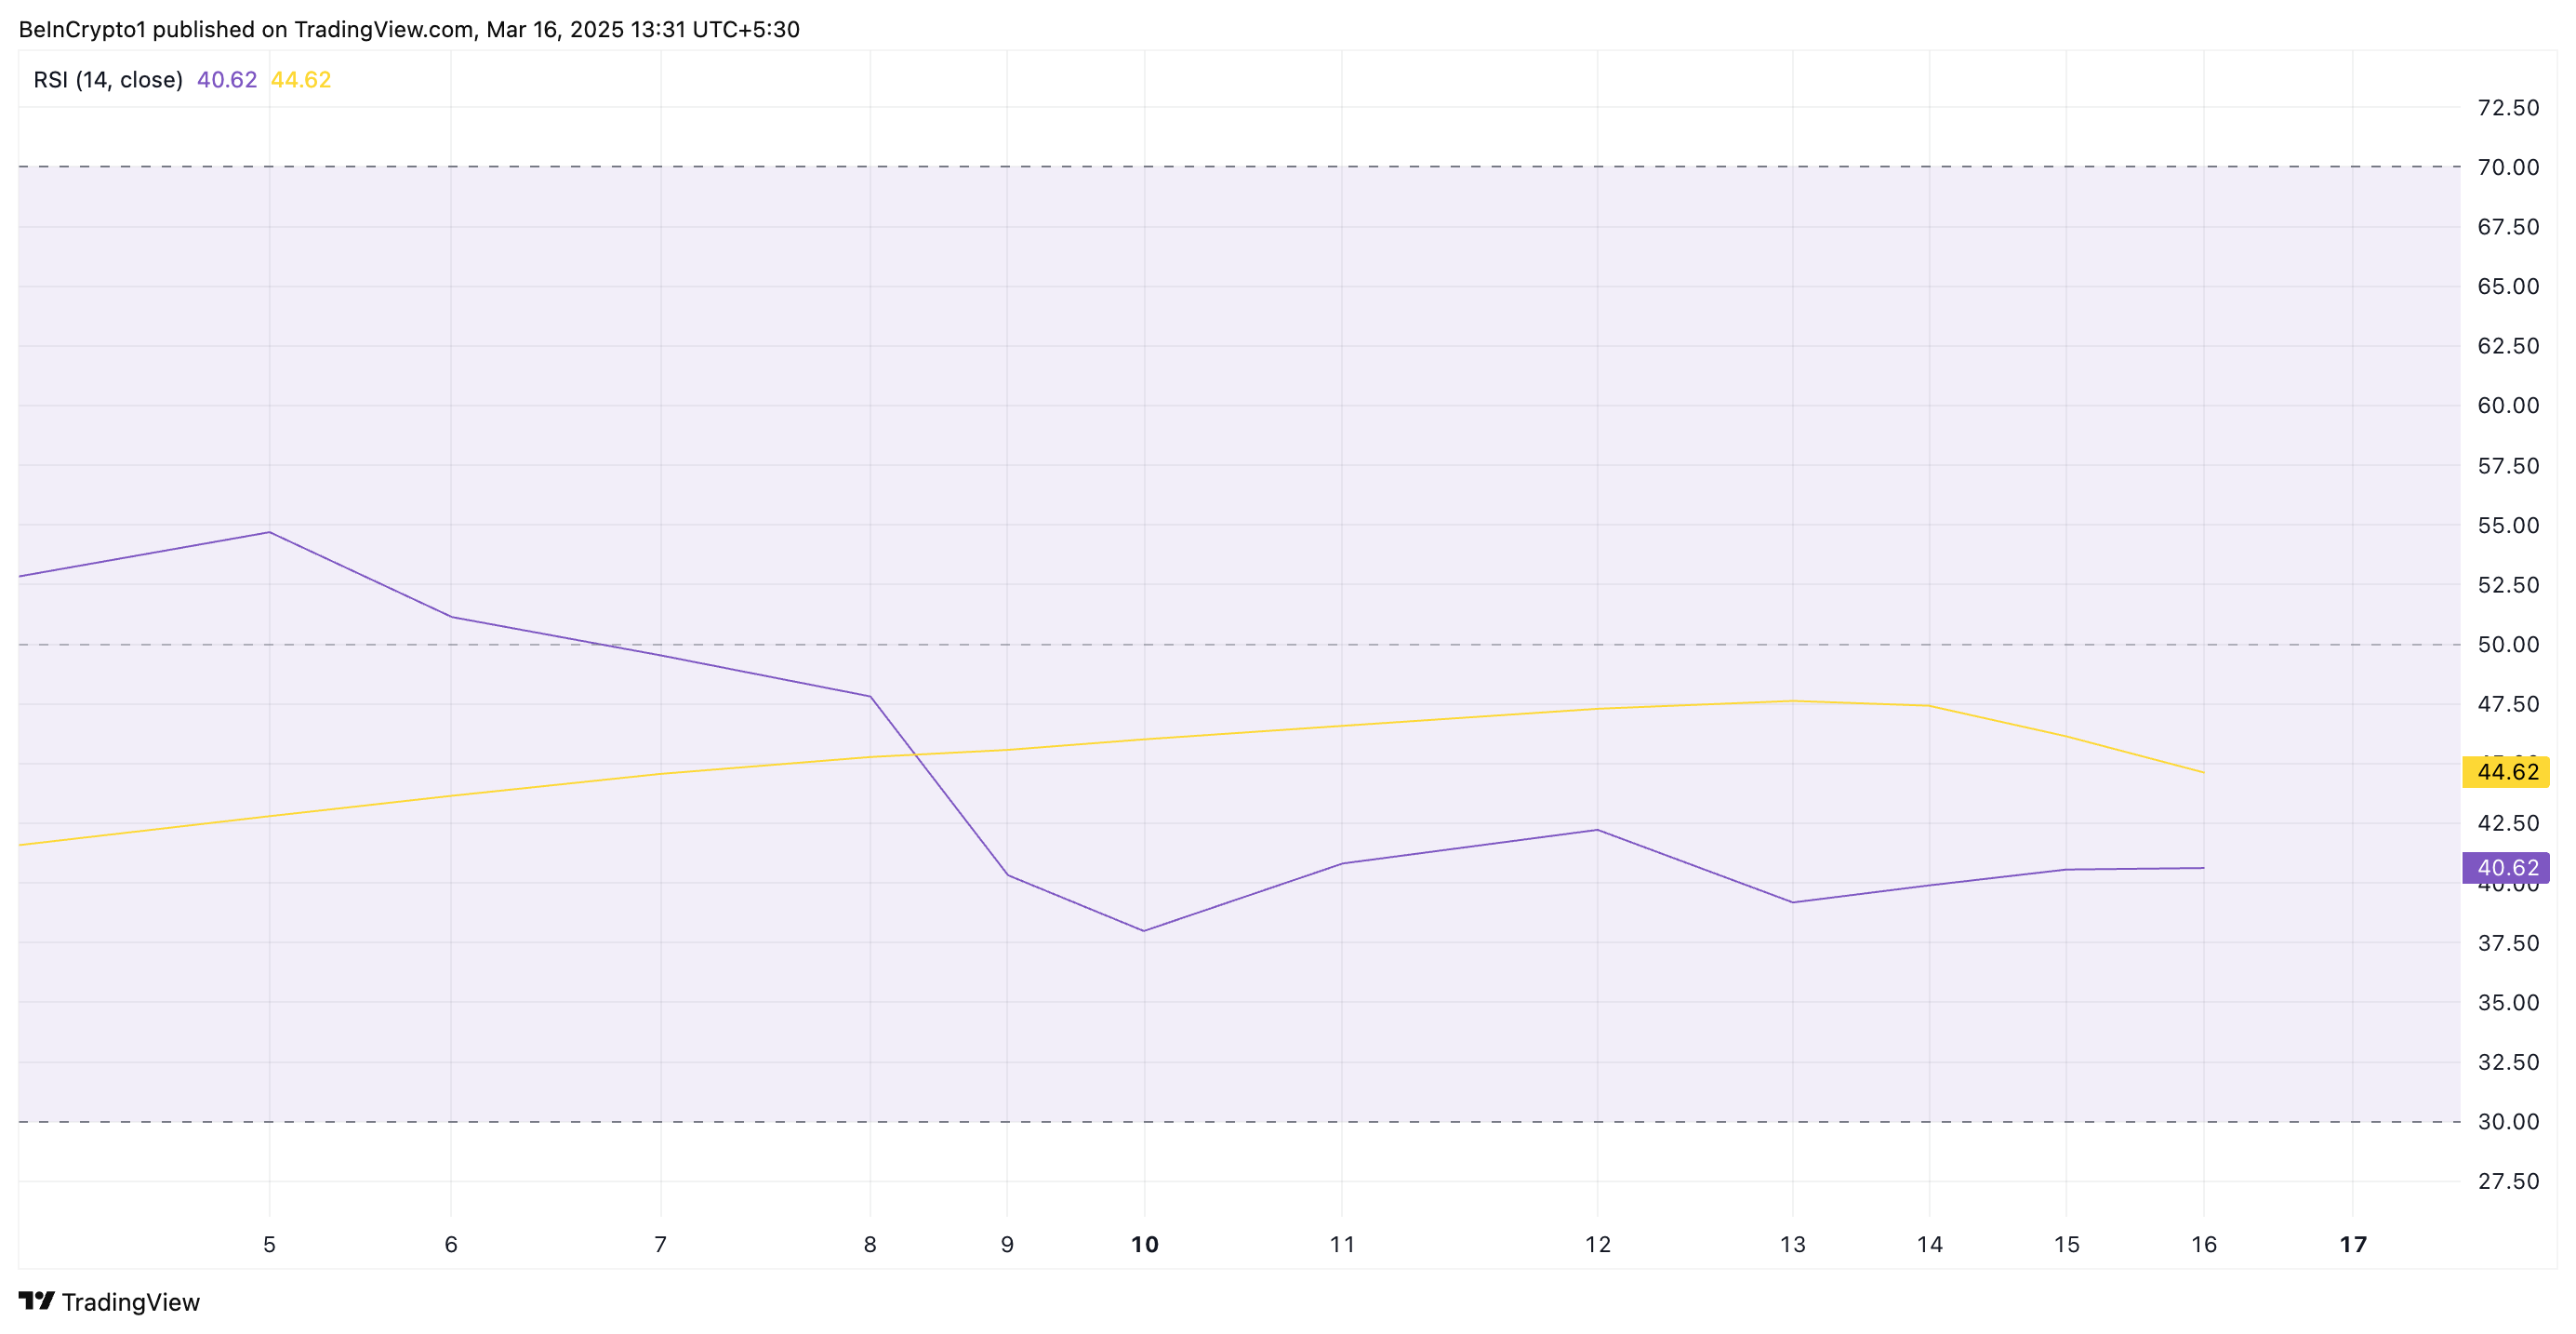 HBAR RSI. Source:
TradingView
HBAR RSI. Source:
TradingView
The RSI indicator measures an asset’s overbought and oversold market conditions. It ranges from 0 to 100, with values above 70 suggesting the asset is overbought and potentially due for a correction.
Conversely, RSI values below 30 signal the asset is oversold and may be primed for a rebound.
An RSI of 40.62 suggests that HBAR is in bearish territory but not yet oversold. This indicates that selling pressure is stronger than buying momentum, but there is still room for further decline before the token becomes undervalued.
Additionally, readings from HBAR’s Elder-Ray Index support the bearish outlook. It currently sits at -0.02, marking its seventh consecutive day in negative territory.
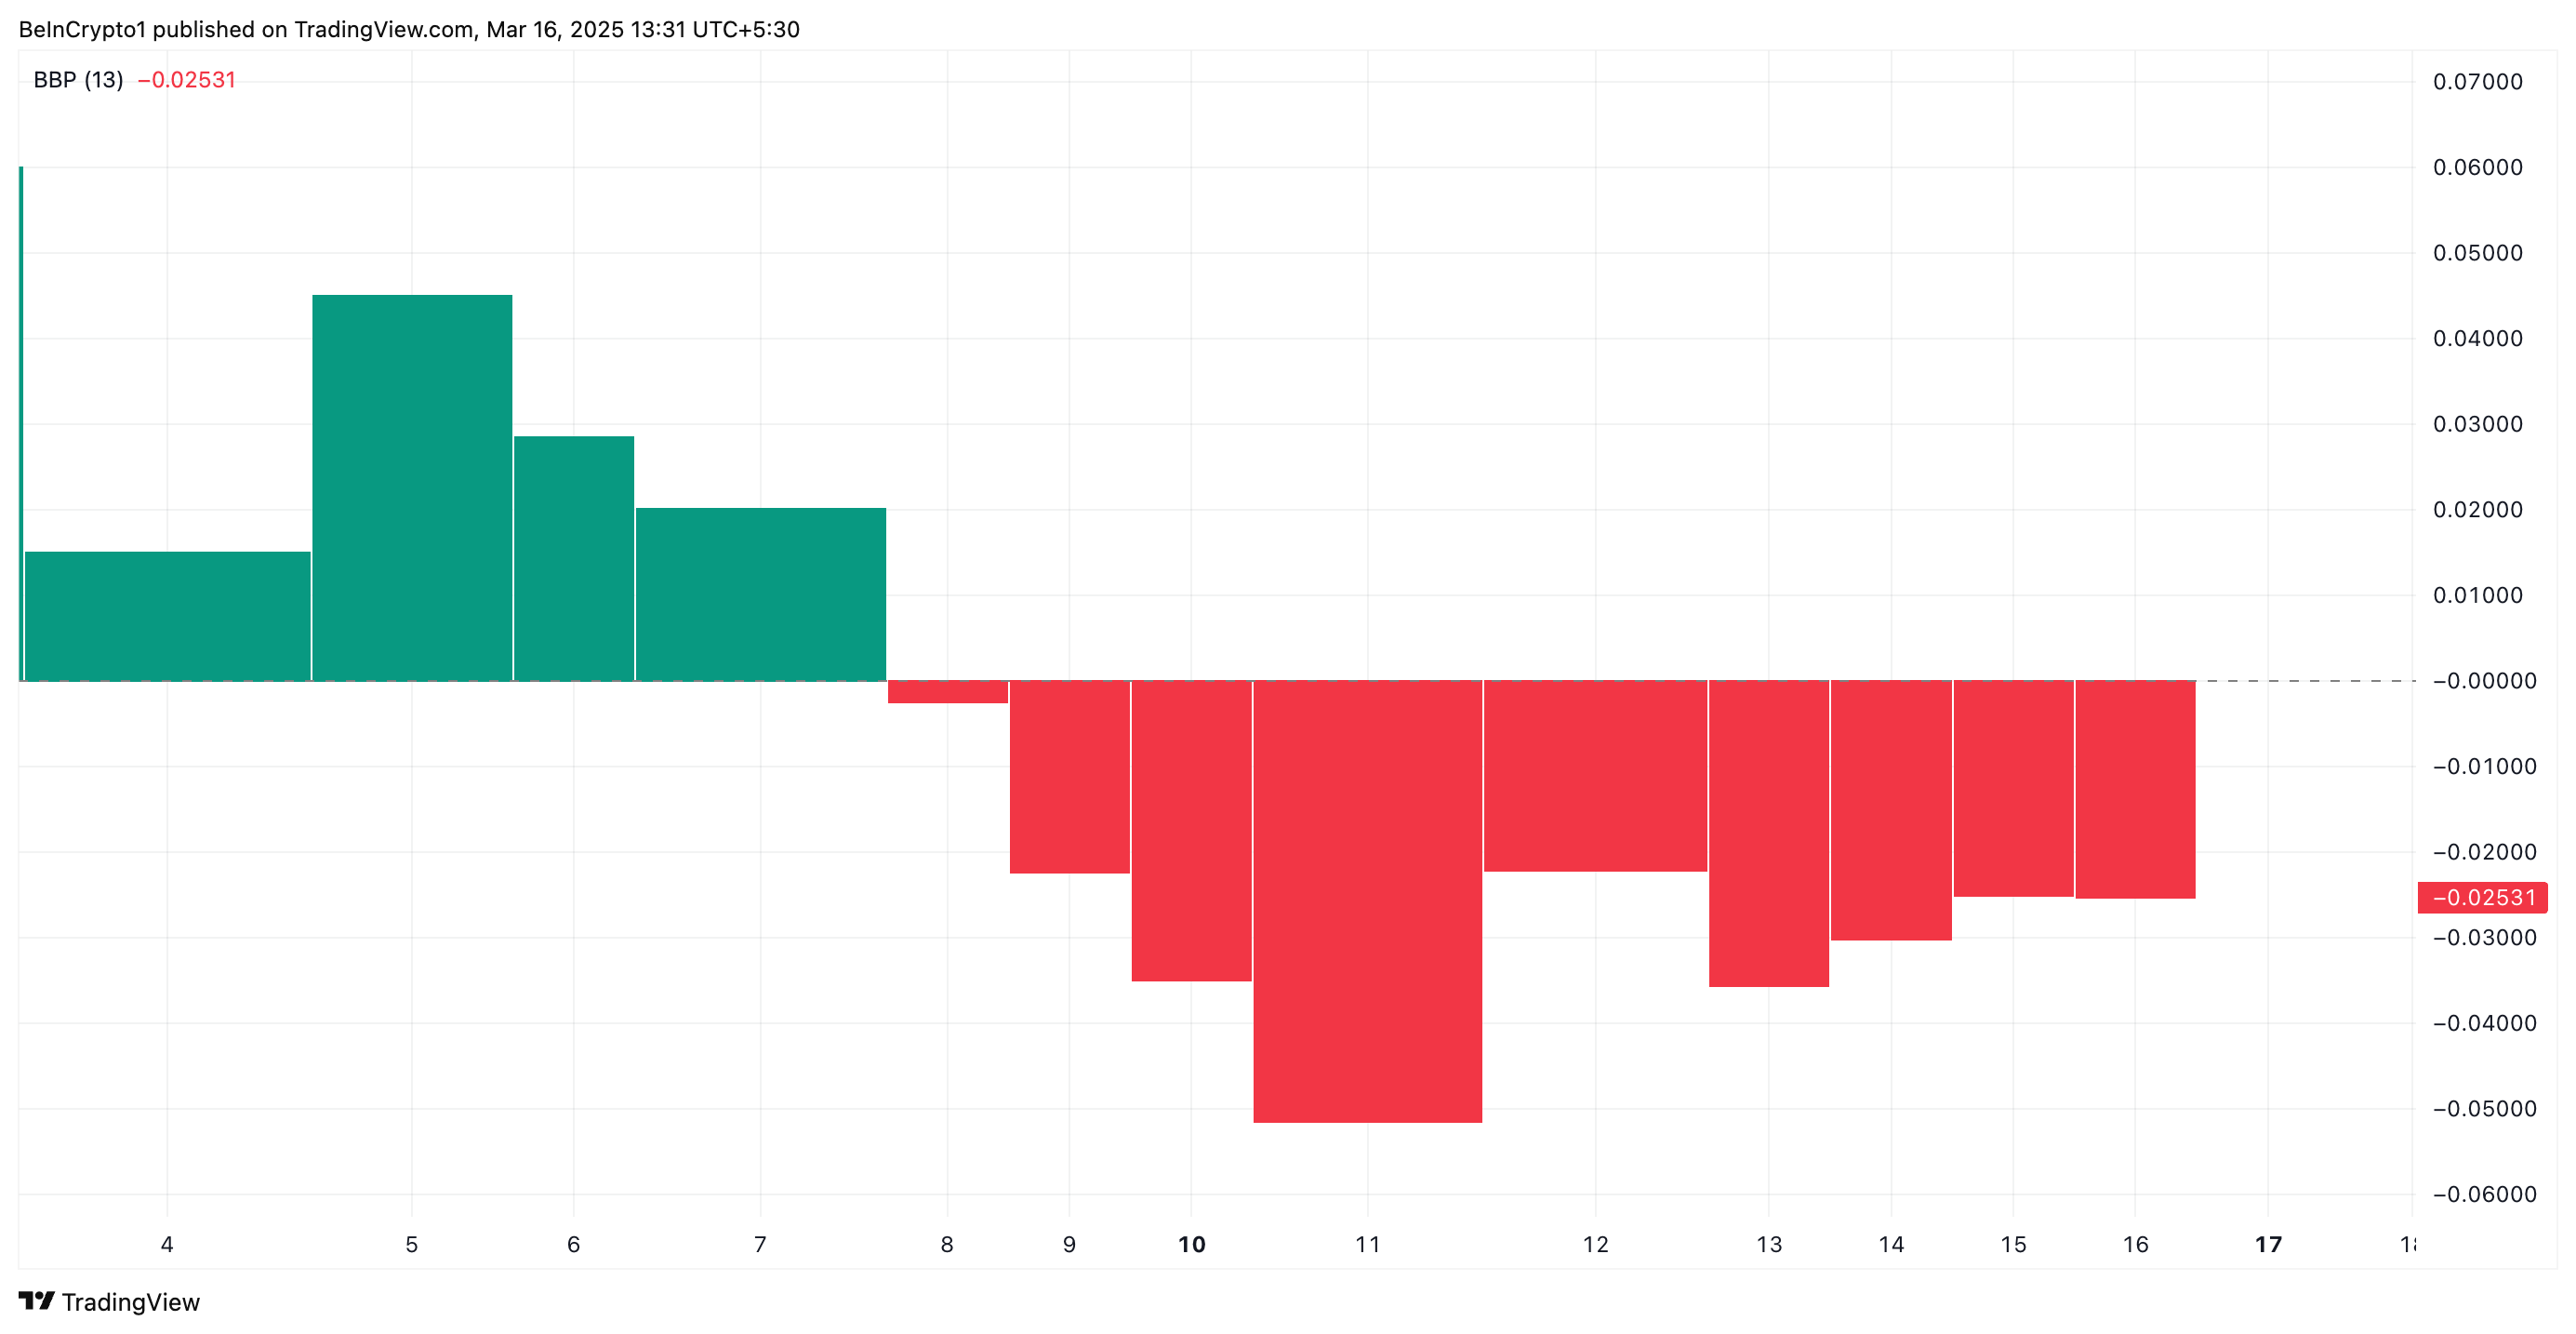 HBAR Elder-Ray Index. Source:
TradingView
HBAR Elder-Ray Index. Source:
TradingView
The Elder-Ray Index measures the balance of power between bulls and bears by analyzing the strength of buyers (Bull Power) and sellers (Bear Power).
When the index is negative, it indicates that sellers are in control, pushing prices lower and signaling a bearish trend. HBAR’s consistent negative Elder-Ray Index suggests sustained downward pressure, making a price recovery less likely in the short term.
HBAR Bears Dominate as Descending Channel Points to More Losses
Since it reached its YTD high of $0.40, HBAR has traded within a descending parallel channel, confirming the price decline.
This bearish pattern is formed when an asset’s price moves between two downward-sloping, parallel trendlines, indicating a consistent bearish trend. It suggests that HBAR sellers are dominant, which could lower its price even more.
If demand weakens further, HBAR could fall toward support formed at $0.16, a low it last reached in November.
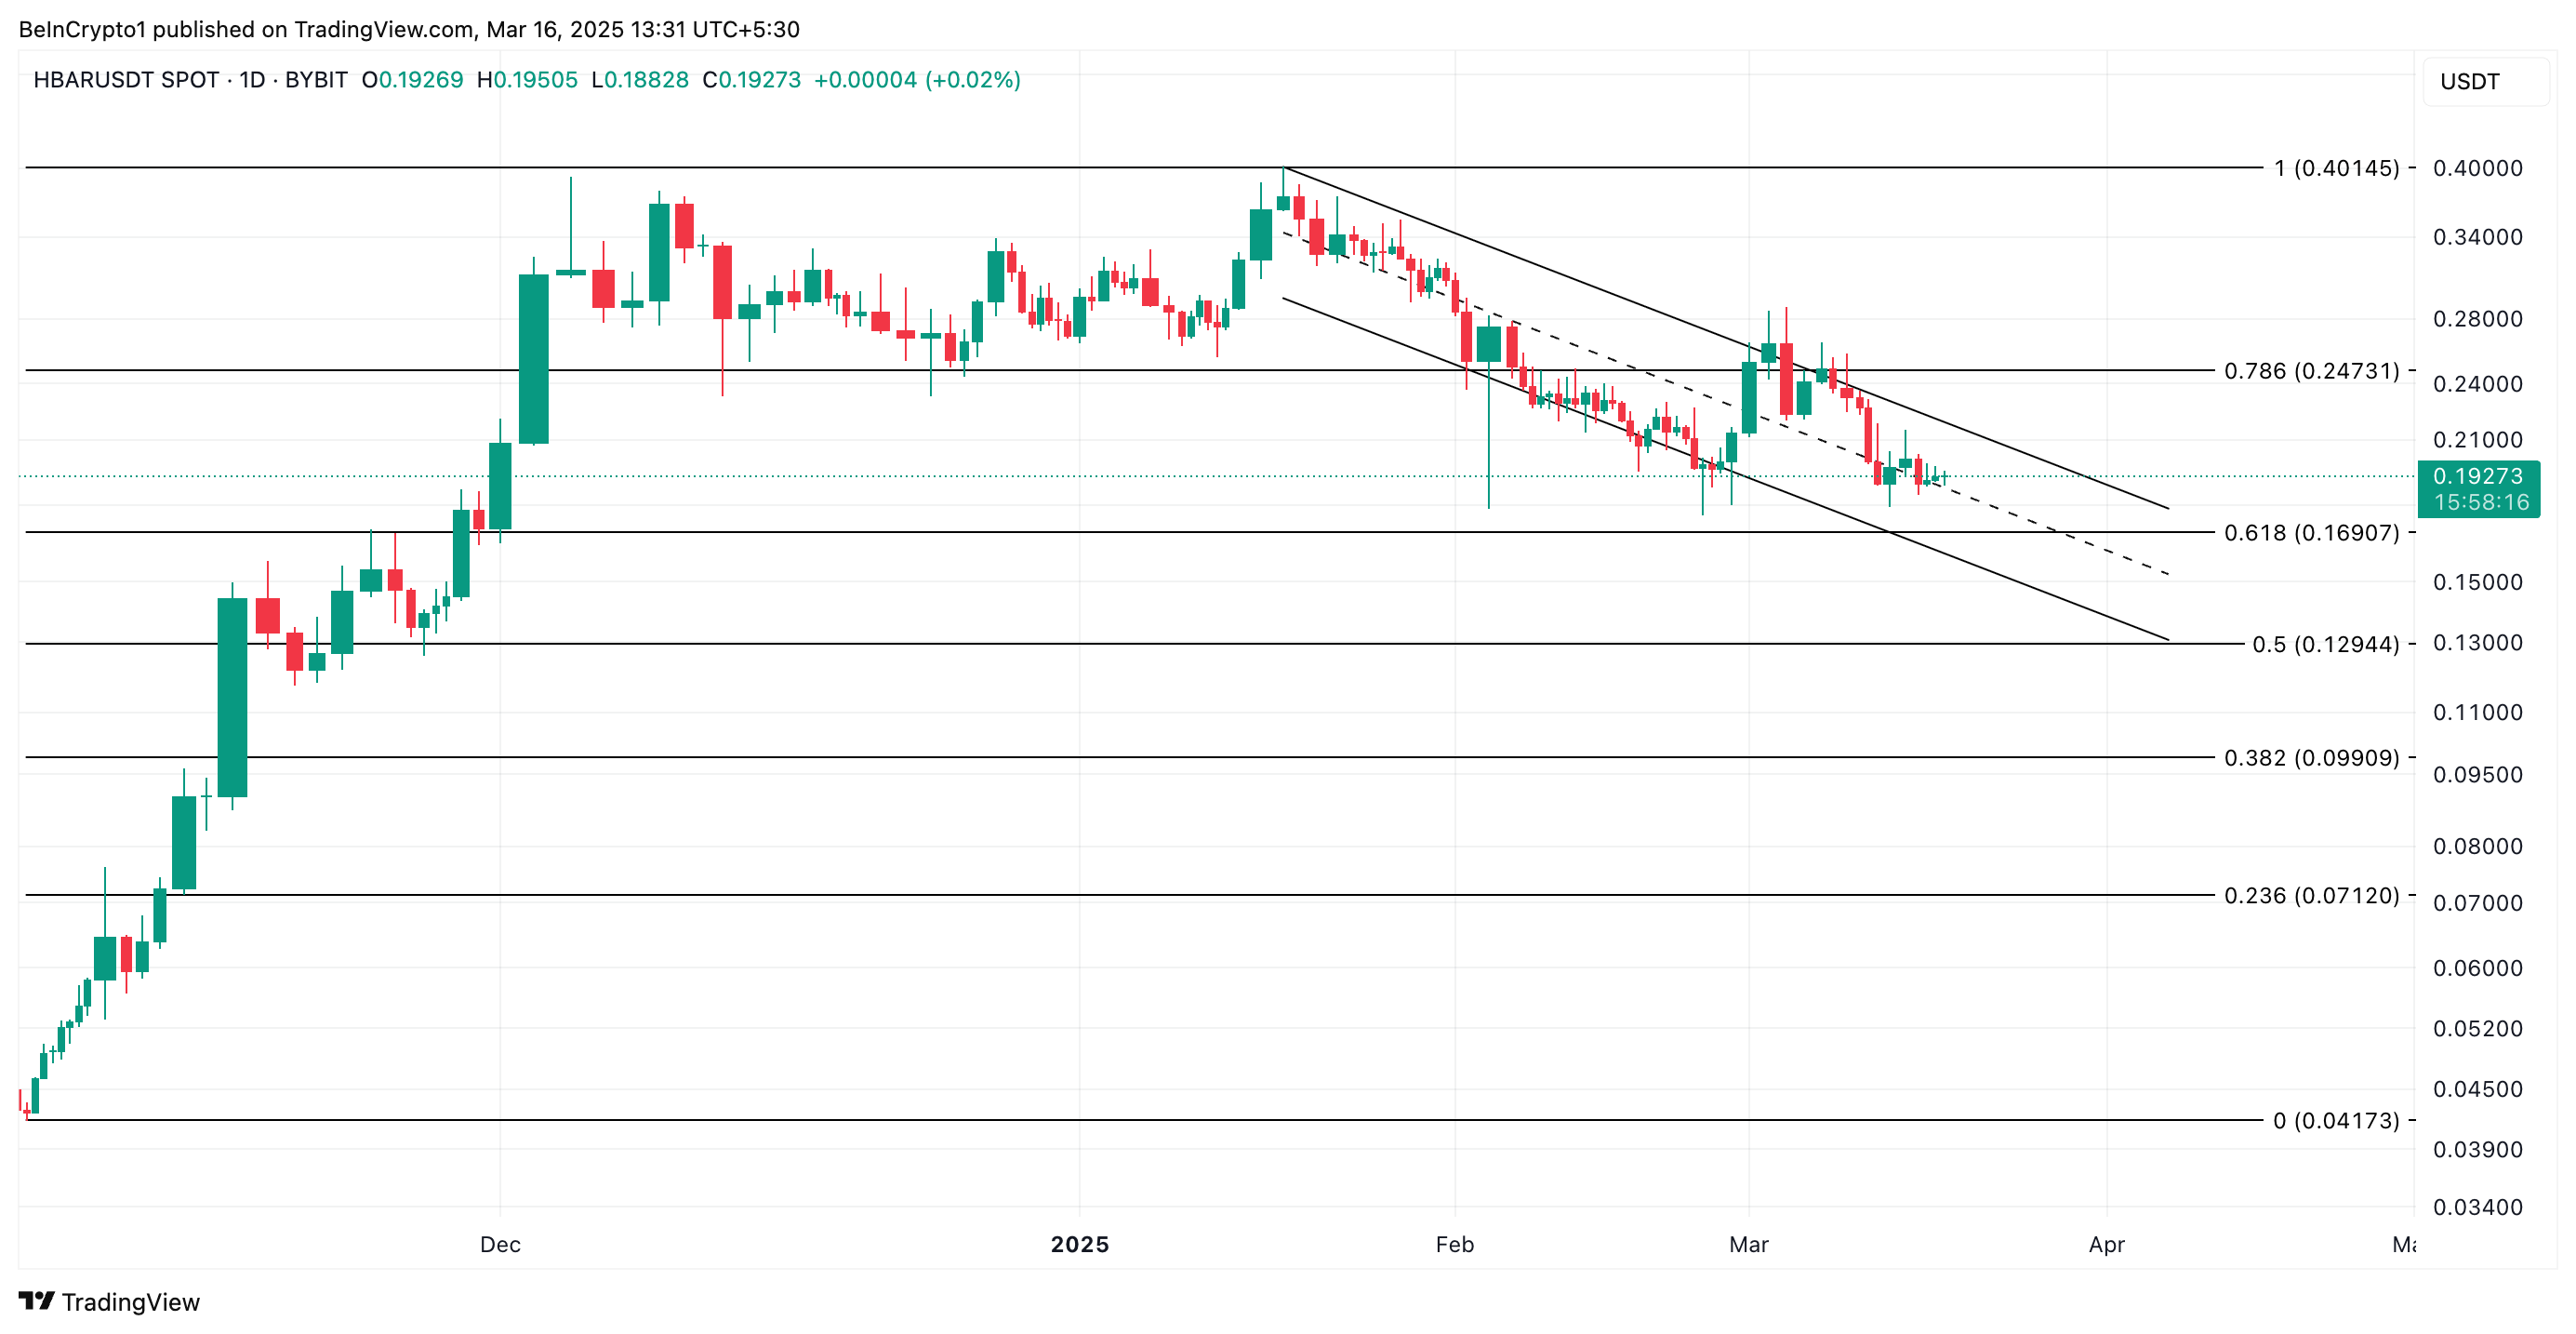 HBAR price Analysis. Source:
TradingView
HBAR price Analysis. Source:
TradingView
However, a positive shift in market sentiment would prevent this. If HBAR sees a surge in new demand, it could drive its price up to $0.24.
Disclaimer: The content of this article solely reflects the author's opinion and does not represent the platform in any capacity. This article is not intended to serve as a reference for making investment decisions.
You may also like
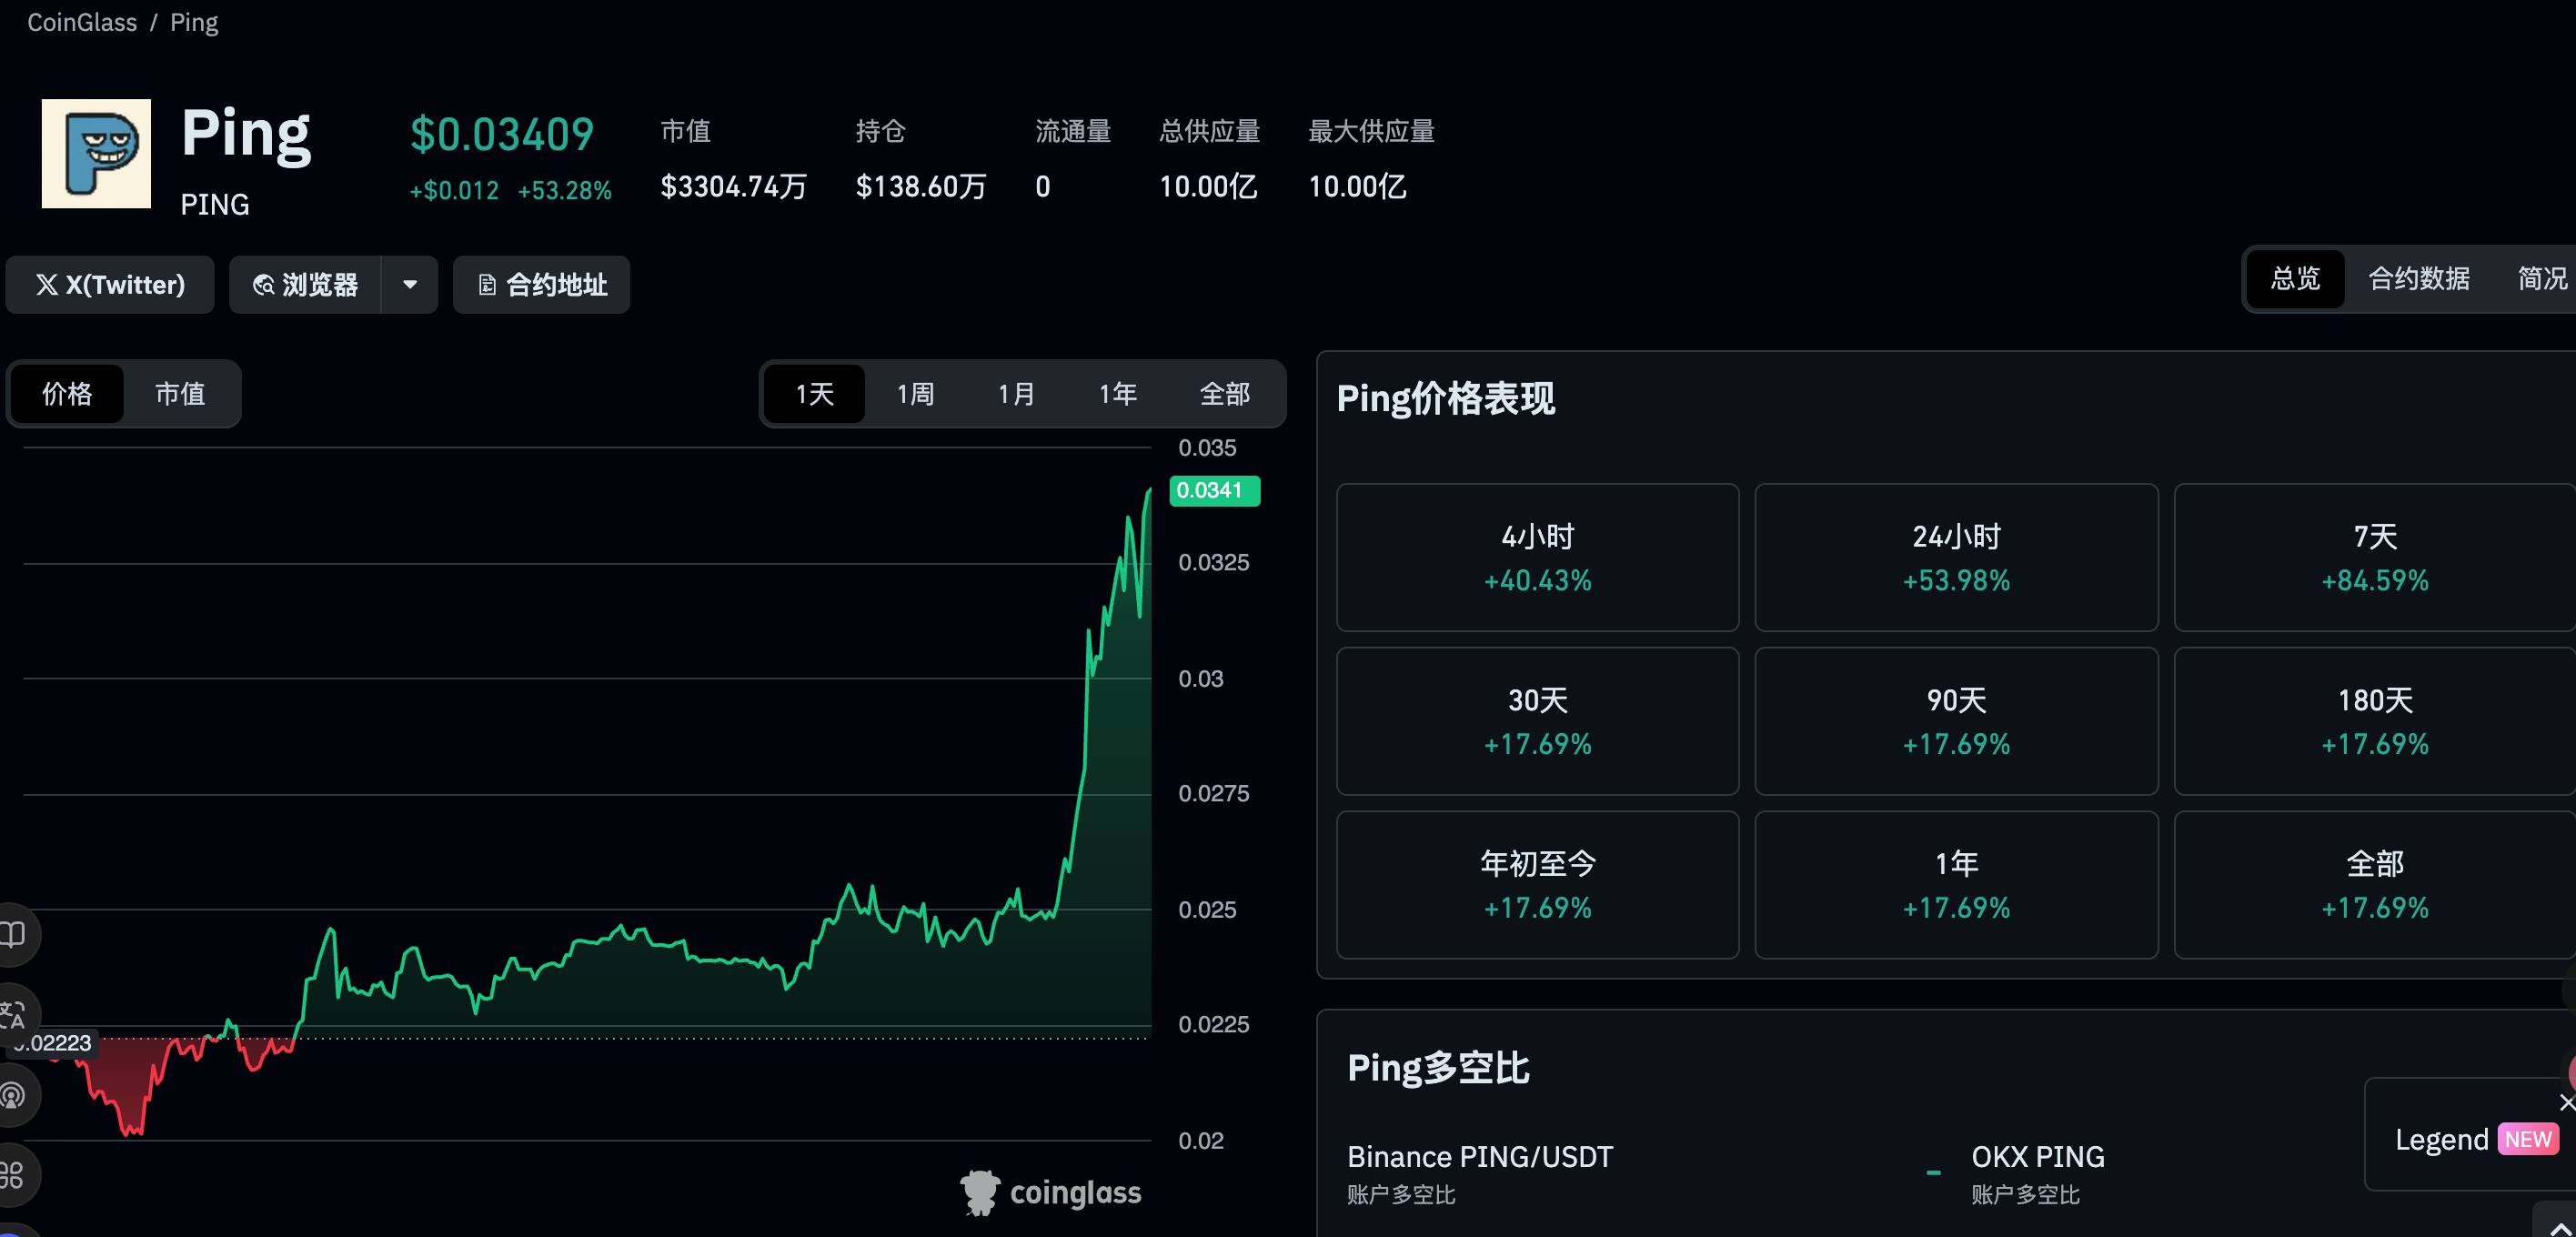
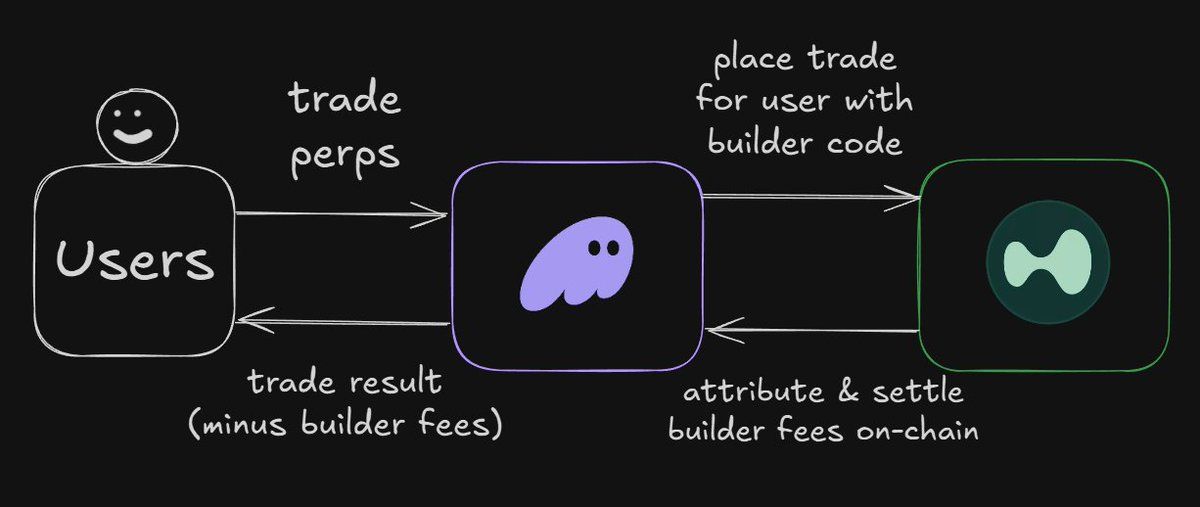
$PING rebounds 50%, a quick look at the $PING-based launchpad project c402.market
c402.market's mechanism design is more inclined to incentivize token creators, rather than just benefiting minters and traders.
Crypto Capitalism, Crypto in the AI Era
A one-person media company, ushering in the era of everyone as a Founder.

Interpretation of the ERC-8021 Proposal: Will Ethereum Replicate Hyperliquid’s Developer Wealth Creation Myth?
The platform serves as a foundation, enabling thousands of applications to be built and profit.
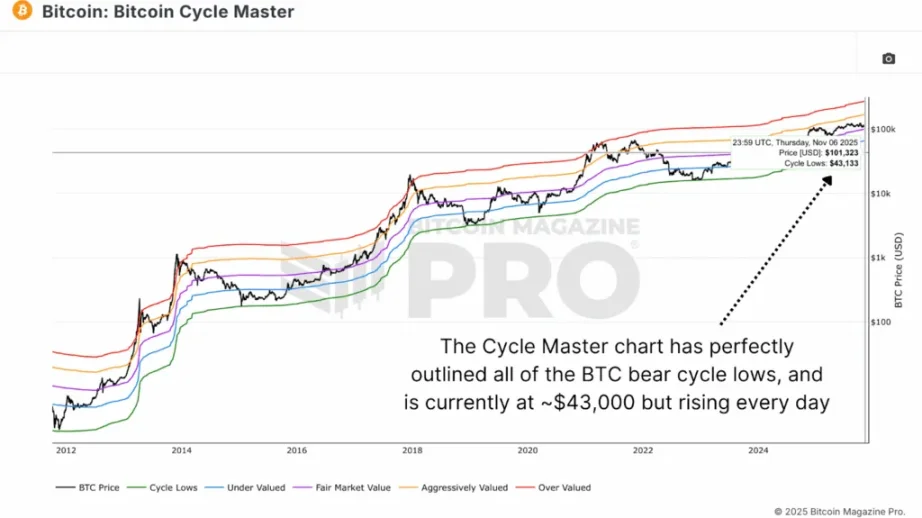
Data shows that the bear market bottom will form in the $55,000–$70,000 range.
If the price falls back to the $55,000-$70,000 range, it would be a normal cyclical movement rather than a signal of systemic collapse.