Bitcoin Charts Suggest Caution Despite Recent Strong Bounce, According to Crypto Trader

Crypto analyst and trader Ali Martinez is warning that Bitcoin ( BTC ) may not be done correcting despite the recent bounce.
Martinez tells his 135,000 followers on the social media platform X that market indicators, including a “death cross” on the daily timeframe, suggest Bitcoin is not convincingly breaking out.
A death cross in technical analysis occurs when the 50-day moving average (MA) drops below the 200-day MA and is used to identify a weakening market.
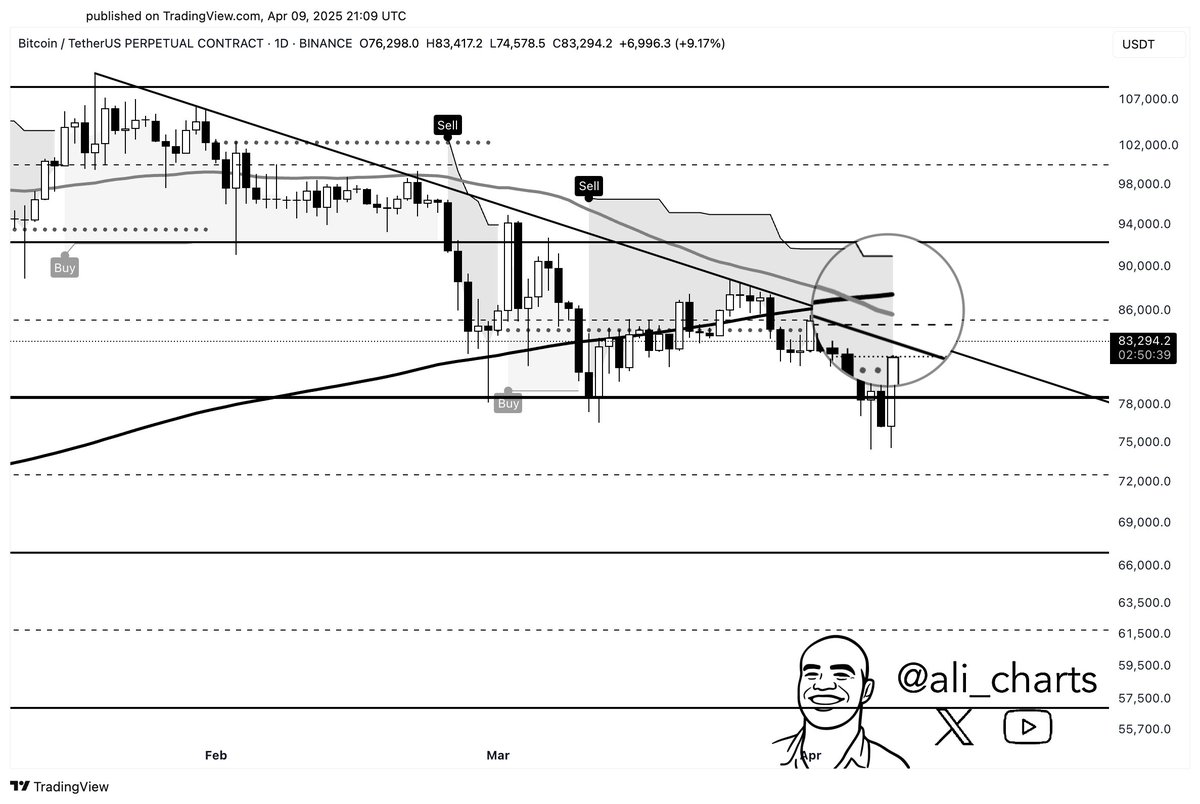
“While the recent Bitcoin bounce has been strong, the higher time frames suggest caution:
- Death cross recently formed on the daily chart.
- SuperTrend indicator still shows ‘Sell.’
- Monthly open at $82,500 acting as resistance.
- Descending trendline from all-time high sits around $84,000.
- 50-day moving average at $85,800.
- 200-day moving average at $87,000.”
 Source: Ali Martinez/X
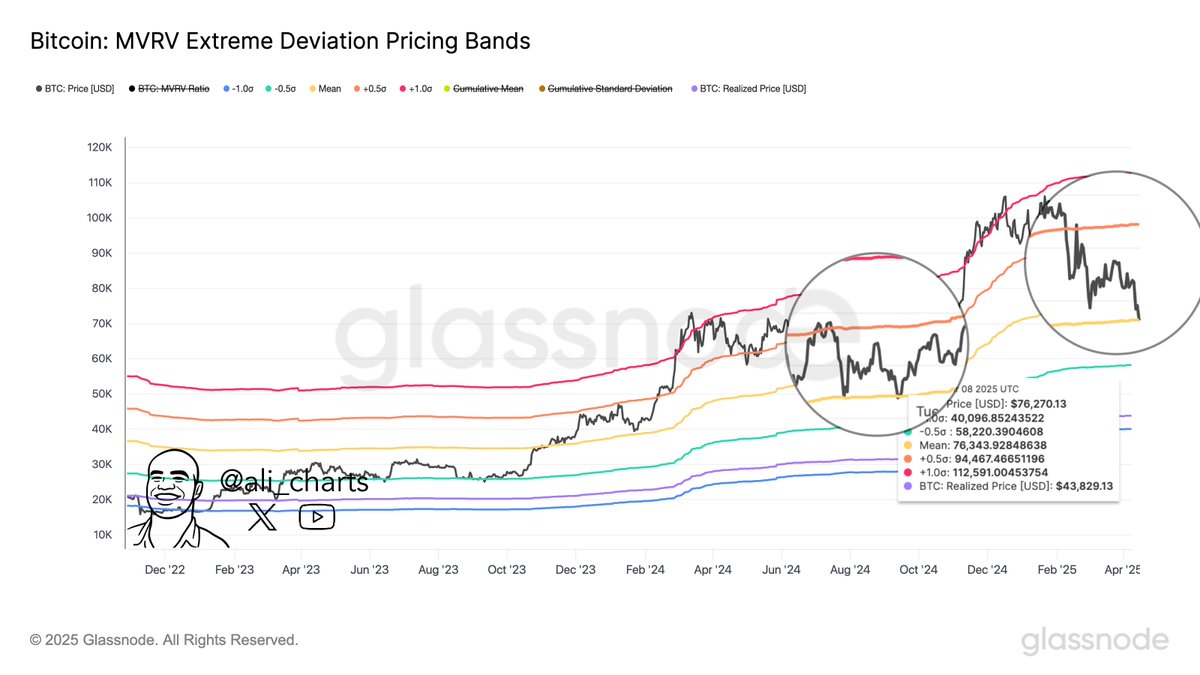
Looking to the upside, Glassnode says that based on the historical precedent of the Market Value to Realized Value (MVRV), the flagship crypto asset faces a key resistance level at $94,500.
The MVRV is the ratio of Bitcoin’s market capitalization compared to its realized capitalization – the value of all Bitcoin at the price they were bought at.
The MVRV’s extreme deviation pricing bands are used to determine possible market bottoms and tops, with the 1.0 standard deviation being the upper band and -1.0 standard deviation being the lower band.
“As Bitcoin rebounds, the next immediate resistance stands at $94,500, according to pricing bands.”
 Source: Ali Martinez/X
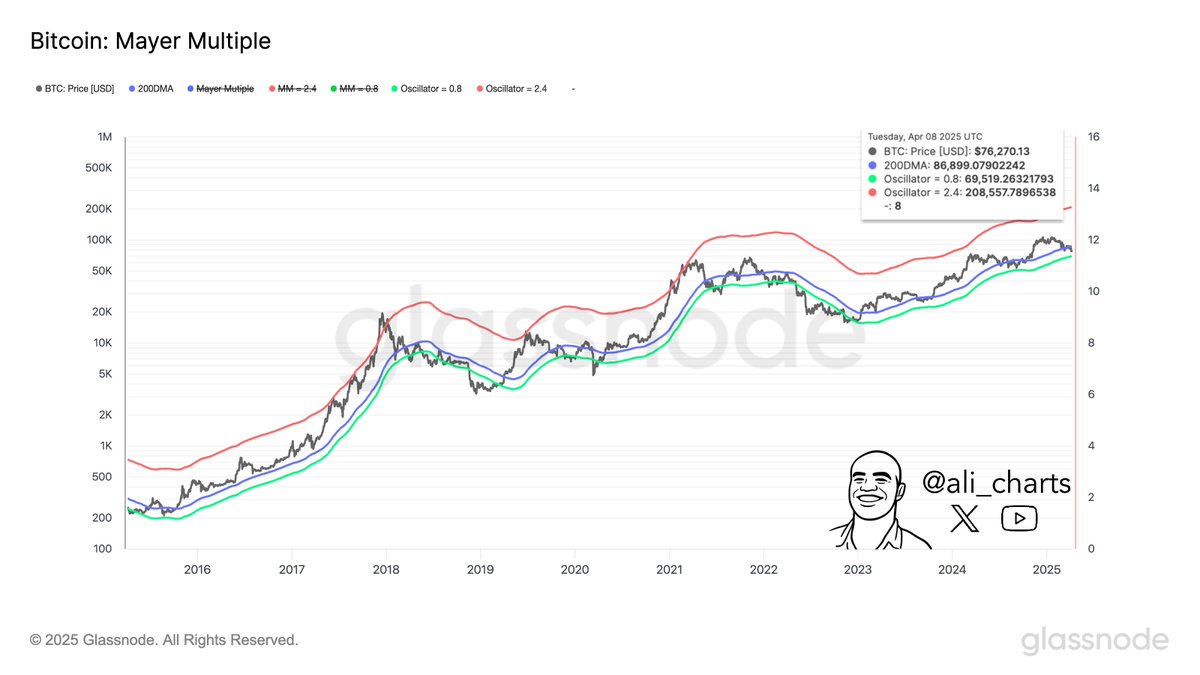
Lastly, the analyst says that Bitcoin may see a massive rally if the top digital asset by market cap can reclaim $86,900 as support based on the Mayer Multiple.
The Mayer Multiple is a technical tool that measures the difference between the current price of BTC and the 200-day moving average to determine if Bitcoin is overbought or oversold.
“Based on the Mayer Multiple, Bitcoin could find solid support around $69,500. And, a breakout above $86,900 might set the stage for a market top near $208,550.”
 Source: Ali Martinez/X
Bitcoin is trading for $79,829 at time of writing, down 3.9% in the last 24 hours.
Follow us on X , Facebook and TelegramDon't Miss a Beat – Subscribe to get email alerts delivered directly to your inbox
Check Price Action
Surf The Daily Hodl Mix
Generated Image: Midjourney
Disclaimer: The content of this article solely reflects the author's opinion and does not represent the platform in any capacity. This article is not intended to serve as a reference for making investment decisions.
You may also like
Last Cycle’s Signal King Murad: 116 Reasons Why the 2026 Bull Market Will Come
I do not agree with the view that the market cycle is only four years; I believe this cycle may extend to four and a half or even five years, and could last until 2026.

Ethereum completes Fusaka upgrade, team claims it can unlock up to 8x data throughput
Major upgrades, which used to take place once a year, are now happening every six months, demonstrating that the foundation still maintains strong execution capabilities despite recent personnel changes.

Glassnode: Is Bitcoin Showing Signs of a 2022 Crash Again? Beware of a Key Range
The current bitcoin market structure is highly similar to Q1 2022, with over 25% of on-chain supply in a loss, ETF capital flows and spot momentum weakening, and the price relying on key cost basis areas.

Crypto Giants Clash: Faith, Utility, and Macro