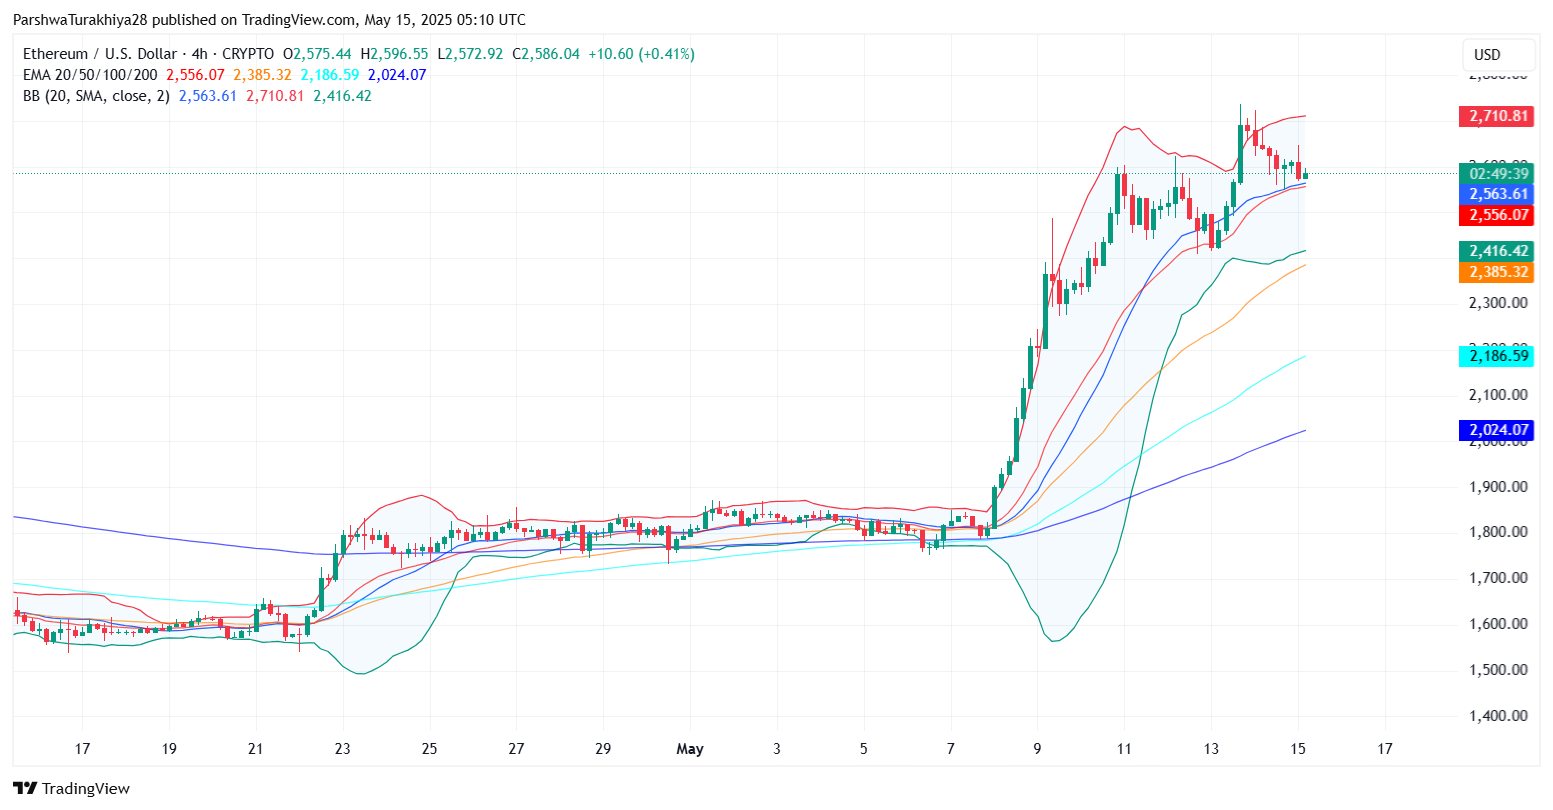
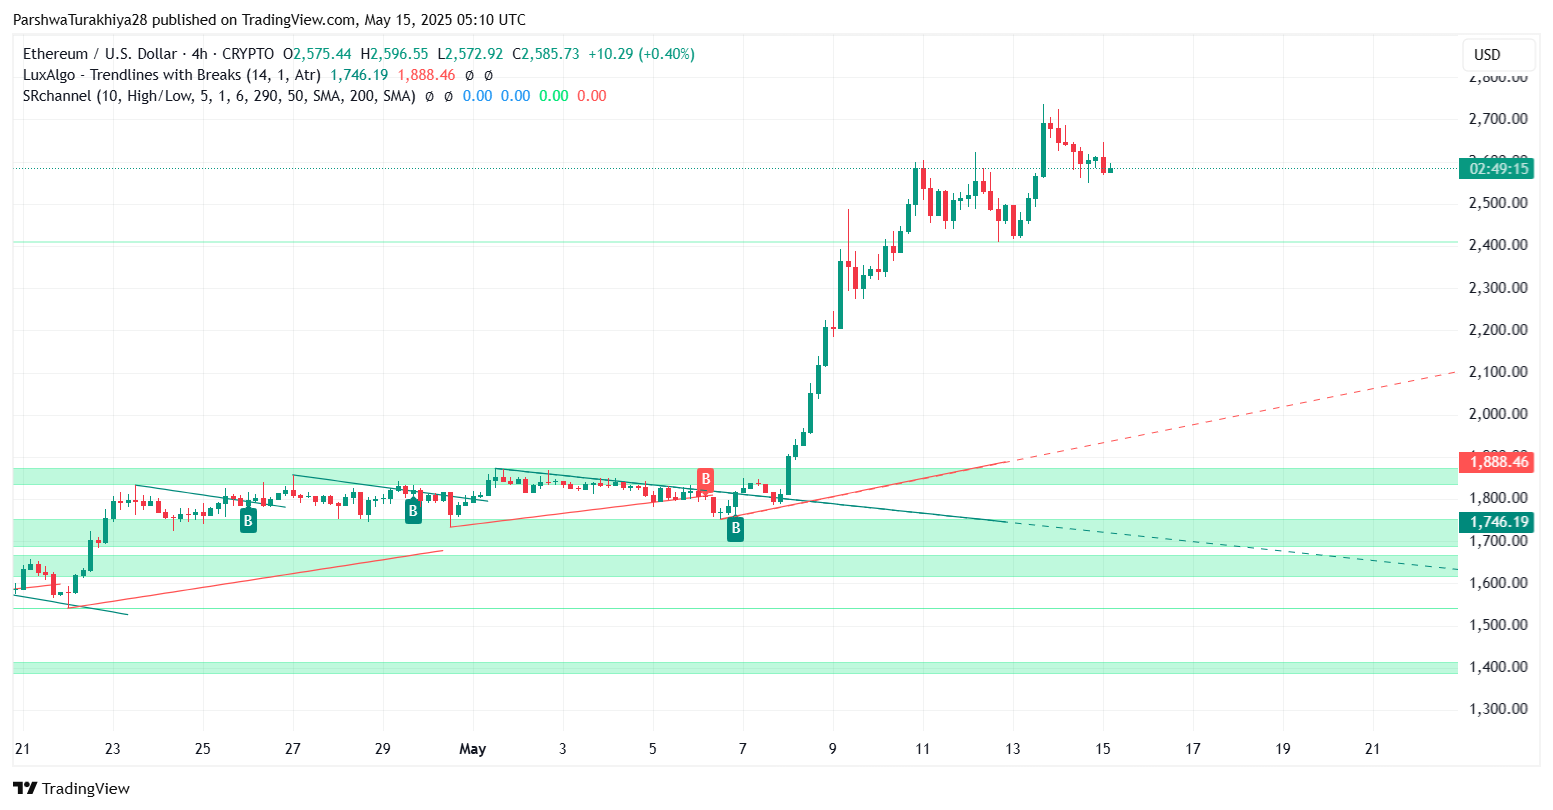
After a ferocious breakout from the $2,000 range, the Ethereum price is currently trading at $2,585, pulling back modestly after facing resistance around $2,710. On the 4-hour chart, ETH is consolidating inside a downward-sloping channel as bulls protect the $2,560-$2,570 zone, which coincides with the 20-EMA and the Bollinger midline. This area acts as dynamic support for now.
 ETHUSD price dynamics ( Source: TradingView)
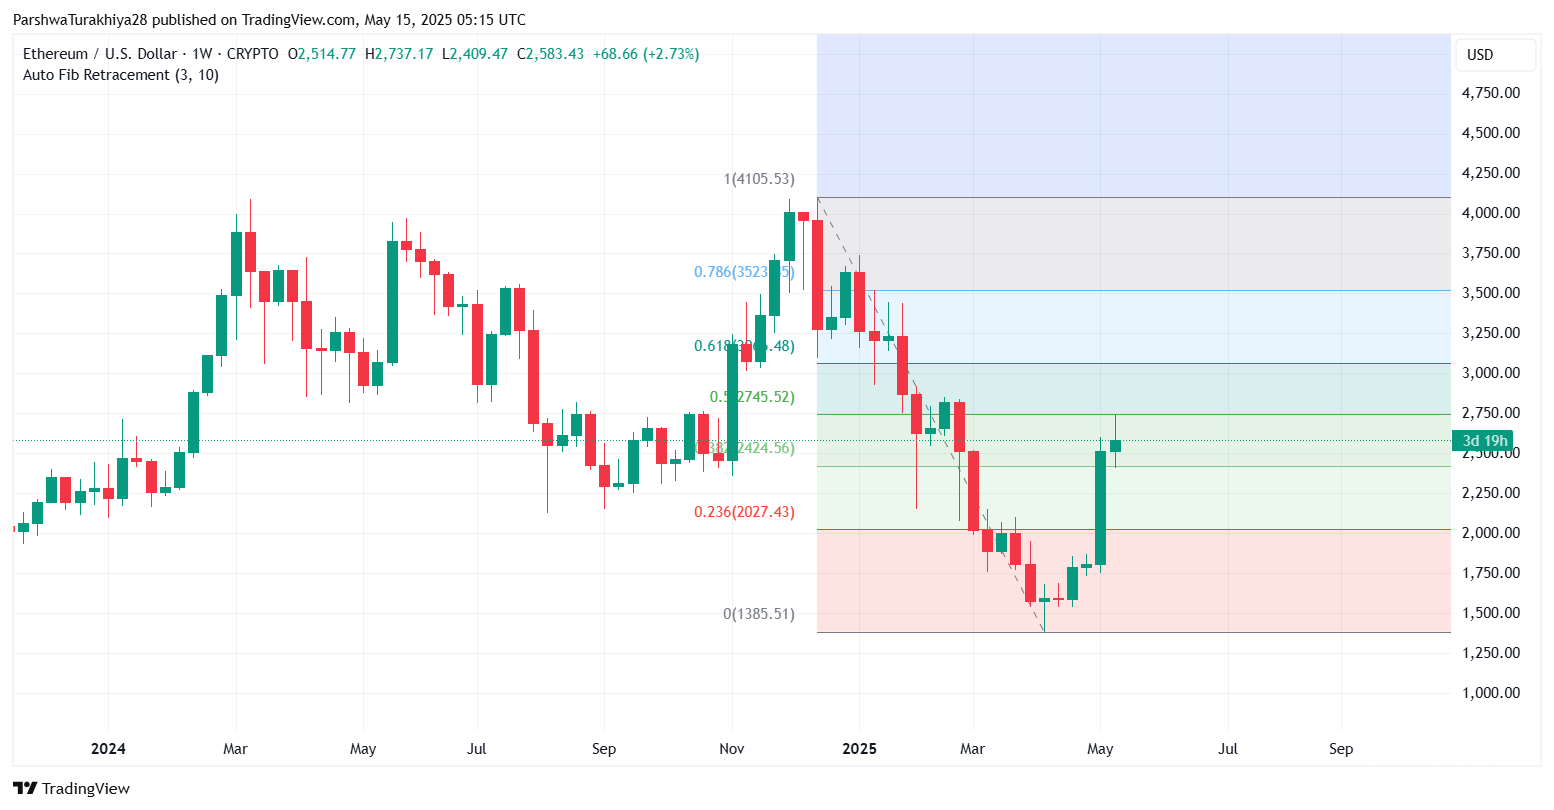
On higher timeframes, the breakout above $2,400 triggered a vertical rally, pushing prices above the 0.5 Fibonacci retracement at $2,745 (from the $4,100–$1,385 range). While Ethereum price today has slightly cooled, the upside structure remains intact unless ETH drops below $2,500, which could open room for a deeper pullback toward the $2,385 and $2,186 levels (EMA 50/100).
 ETHUSD price dynamics ( Source: TradingView)
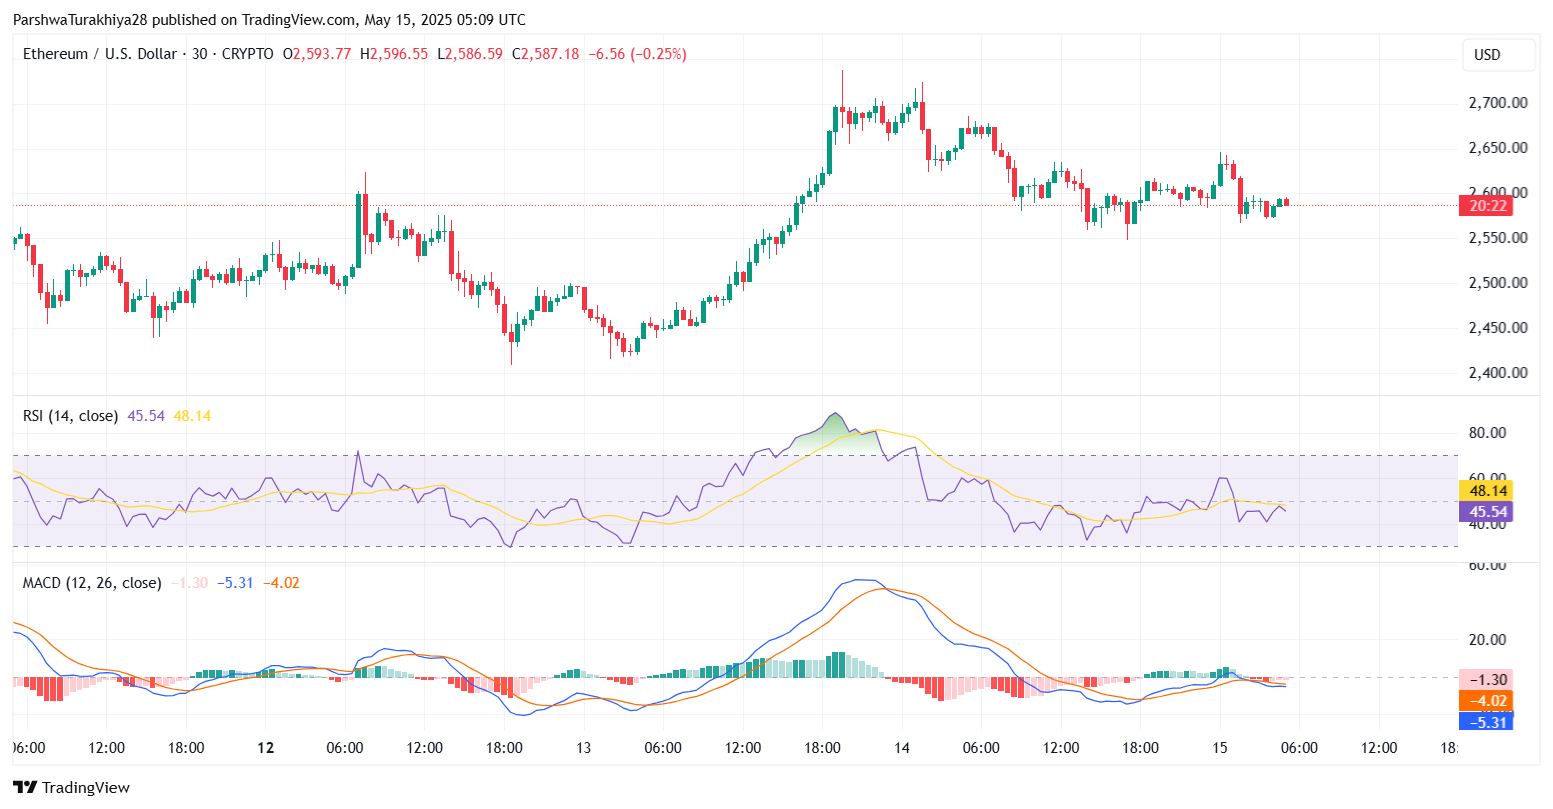
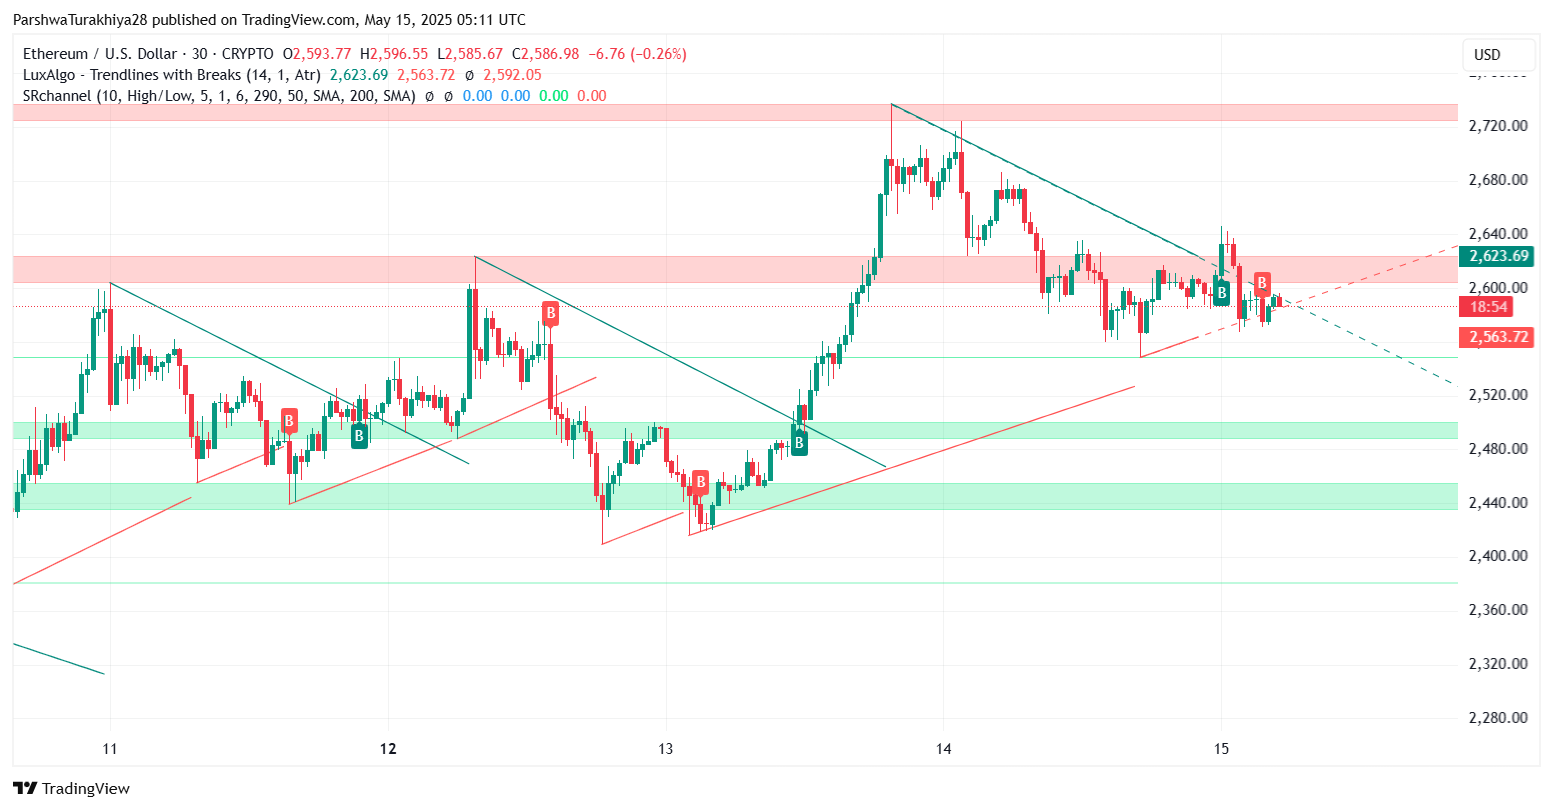
Notably, the RSI on the 30-min chart is neutral at 45.5, while MACD continues to flash a weak bearish crossover, suggesting momentum is fading but not reversing.
Ethereum Price Update: Can Bulls Push Past $2,700 Again?
 ETHUSD price dynamics ( Source: TradingView)
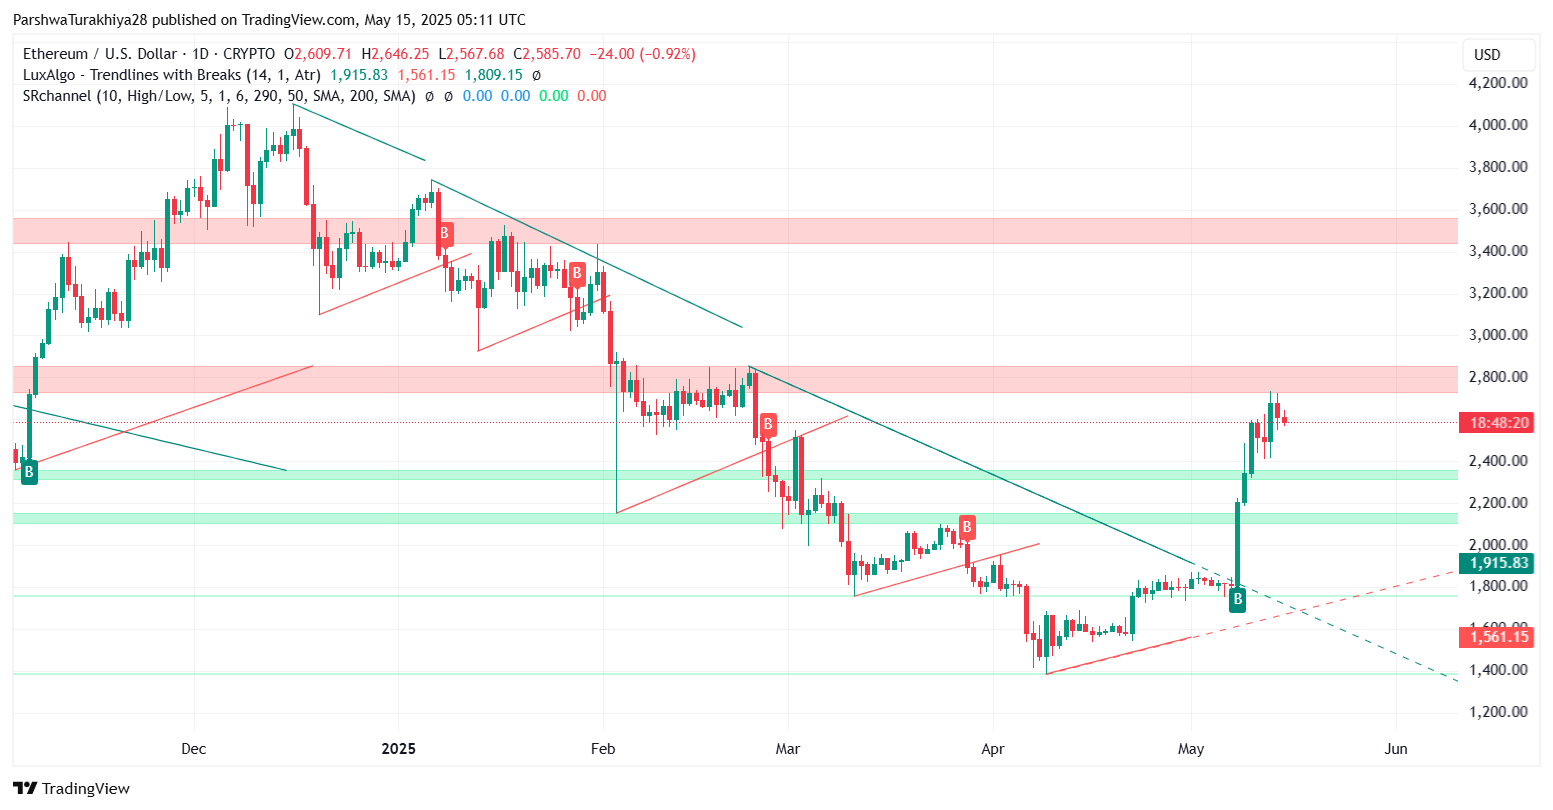
On the daily chart, ETH has broken out of a six-month descending trendline, clearing resistance zones around $2,200 and $2,400 with high volume. The rejection at the $2,710 zone aligns with a bearish order block from January 2024, making it a critical level to flip for any sustained advance.
 ETHUSD price dynamics ( Source: TradingView)
The Ethereum price action shows a strong bullish structure supported by higher lows and a base breakout around $1,800. But after such an extended move, some Ethereum price volatility is expected. The Ichimoku Cloud on the 4H frame remains firmly bullish with price holding above the Kijun-sen and Tenkan-sen, although a minor correction is playing out. The Stoch RSI near 80 suggests a cooling-off phase is likely.
If ETH sustains above the short-term uptrend support near $2,560, another rally toward the $2,710–$2,745 resistance band could be on the cards. However, failure to hold this region may trigger a drop to the $2,500 liquidity pocket. Below this, $2,385 (4H EMA50) and $2,186 (4H EMA100) would be the next support levels.
Why Ethereum Price Going Down Today?
 ETHUSD price dynamics ( Source: TradingView)
The current cooldown stems from profit-taking after a near 35% rally in under a week. The MACD on the 4H frame is also flattening, with histogram bars fading, signaling reduced bullish momentum. Still, there’s no confirmed reversal—only a pause in trend.
 ETHUSD price dynamics ( Source: TradingView)
For the remainder of the week, price action will be dictated by whether ETH can reclaim the $2,620 resistance and break past the $2,710 cap. A clean break would target $2,850 next, with $3,025 sitting near the 0.618 Fib retracement. On the downside, keep an eye on $2,500 and $2,385.
Ethereum Forecast Table: ETH Key Levels
| Timeframe | Support Levels | Resistance Levels | Indicators (4H) |
| Intraday | $2,560 / $2,500 | $2,620 / $2,710 | RSI: 45.5, MACD: Bearish Crossover |
| Short-Term | $2,385 / $2,186 | $2,745 / $2,850 | EMA 20/50/100 Bullish Alignment |
| Weekly | $2,024 / $1,915 | $3,025 / $3,525 | Weekly Fib 0.5: $2,745 |
In our May 14 ETH analysis , we highlighted the potential for ETH to reclaim $2,500 and move toward $2,700. That setup played out with precision, confirming the bullish bias. Now, with ETH hovering in a tight band, traders should watch if price maintains above the 20-EMA on 4H and prepares for another leg up or pauses for re-accumulation below $2,700.
Disclaimer: The information presented in this article is for informational and educational purposes only. The article does not constitute financial advice or advice of any kind. Coin Edition is not responsible for any losses incurred as a result of the utilization of content, products, or services mentioned. Readers are advised to exercise caution before taking any action related to the company.