
PEPE Coin: Meme Rally Continues or Crash Risk Ahead?

As meme coins battle for spotlight once again, PEPE coin price is showing signs of a potential breakout —or a brewing correction. Let’s dive deep into both the hourly and daily TradingView charts of PEPE coin price to understand whether this rally is just getting started or standing on weak legs.
Pepe Coin Price Prediction: Is PEPE Losing Steam or Building for a Breakout?
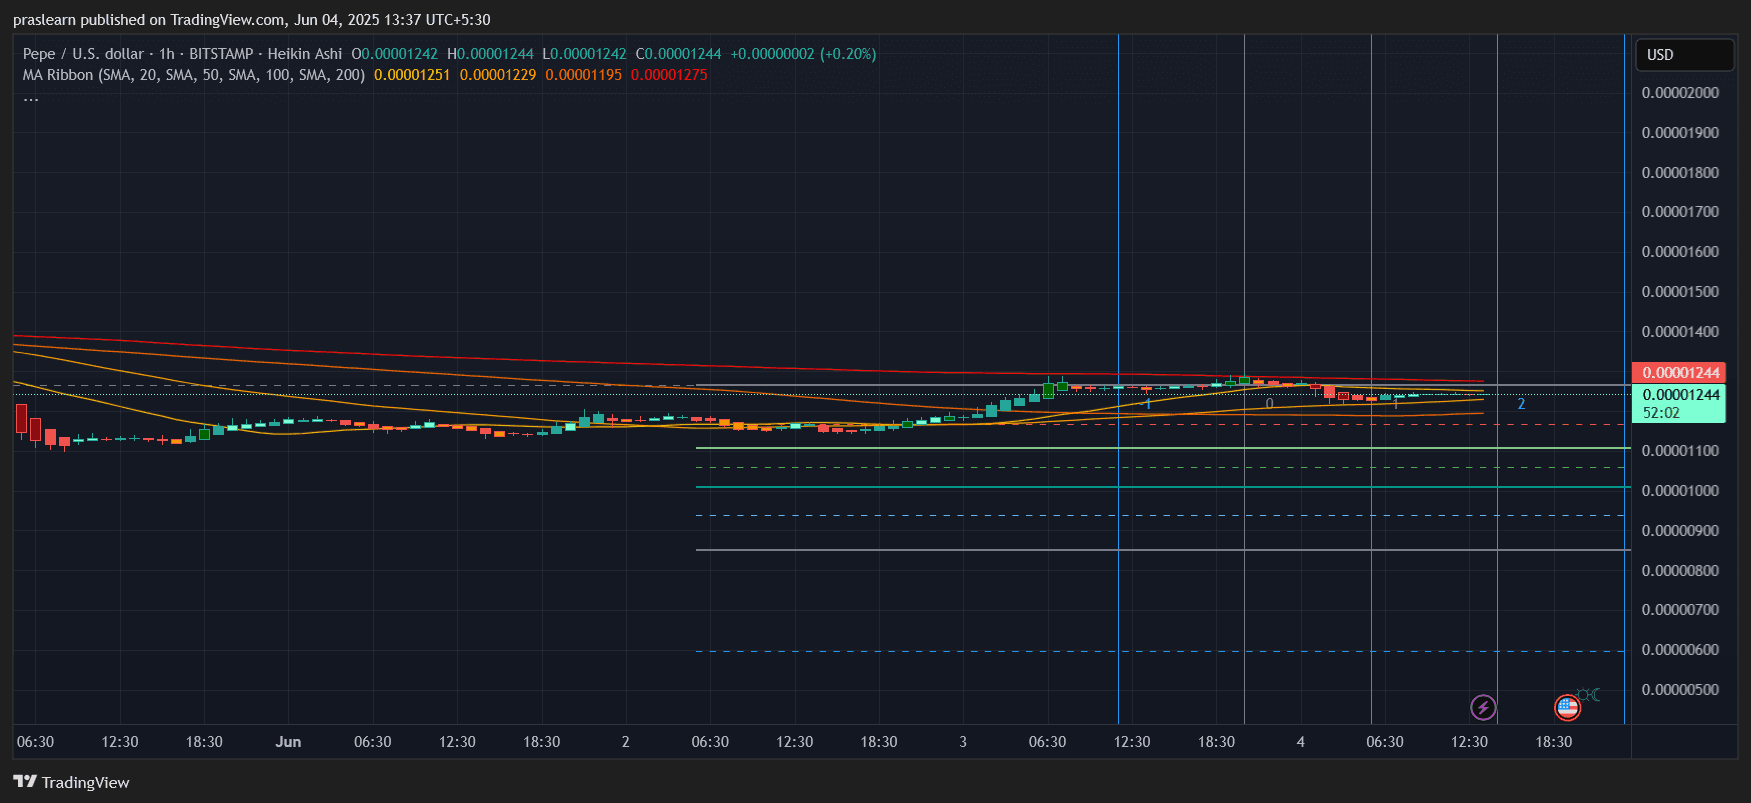 PEPE/USD 1 Hr chart- TradingView
On the hourly chart, PEPE coin price is consolidating just under major resistance levels. The price is hovering around $0.00001244, with tight movement over the last 48 hours. What's notable is that the 20 SMA ($0.00001251) is acting as immediate overhead resistance, while 50 SMA ($0.00001229) is closely supporting the current zone. The 200 SMA, however, is still significantly higher around $0.00001275, suggesting that PEPE has room to climb if volume kicks in.
Despite this compression, Heikin Ashi candles are showing mild bullish bias with higher lows, but not enough momentum yet to break through the resistance cluster formed by the 20 and 200 SMAs.
So far, PEPE coin price has gained around +5.75% since bouncing from the support area near $0.00001175, but unless it breaks $0.00001275 convincingly, bulls might not see fireworks.
What Does the Daily Chart Reveal?
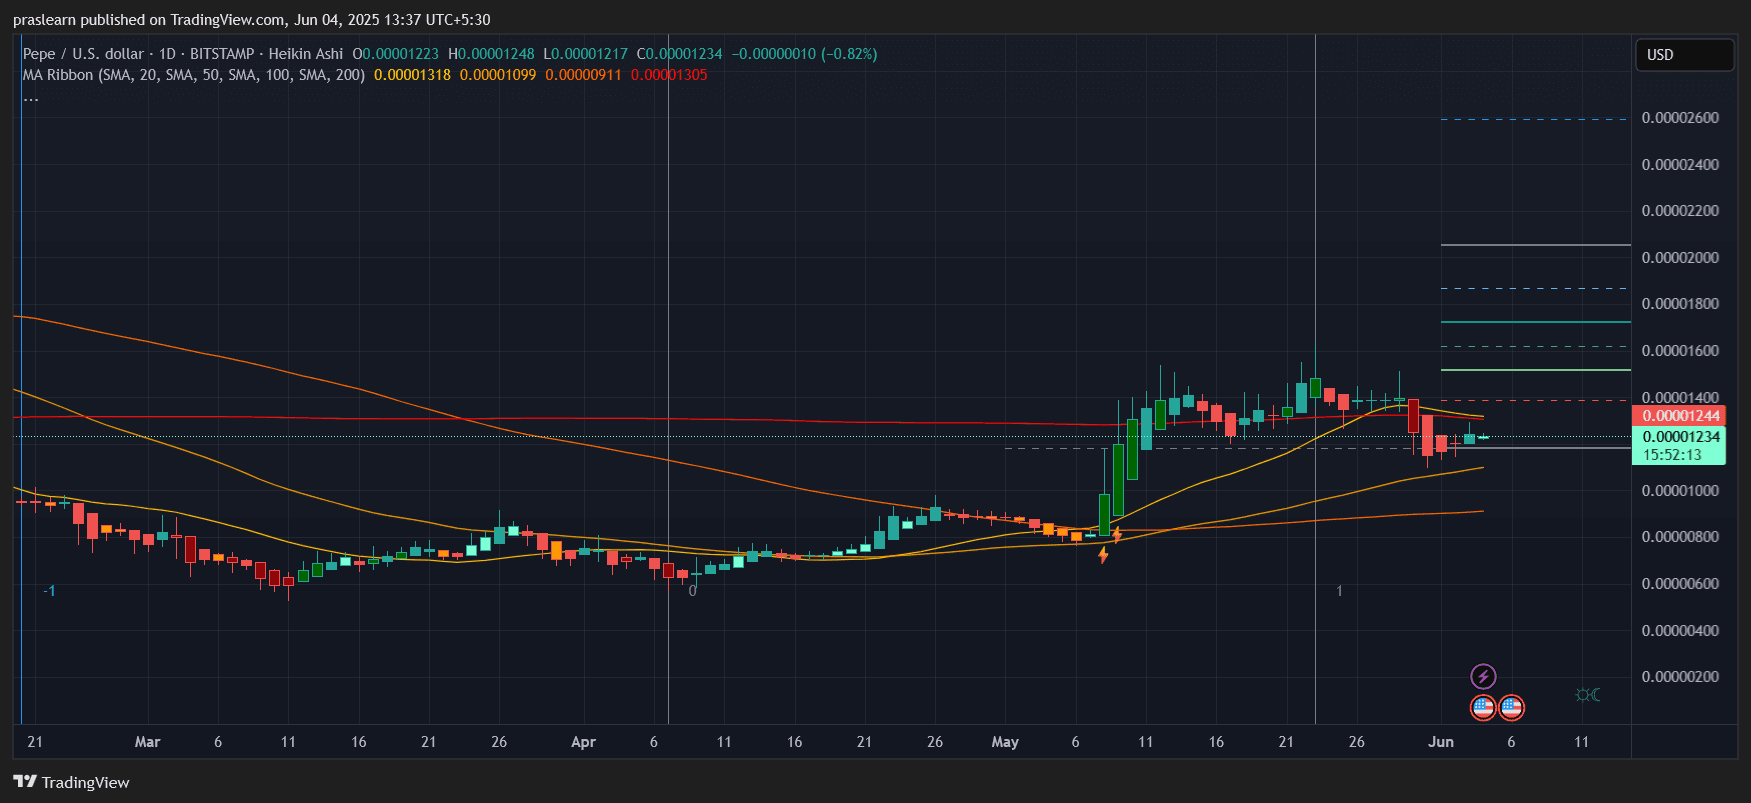 PEPE/USD 1 Day chart- TradingView
The daily chart tells a broader story. PEPE coin saw a strong impulse rally in early May, followed by a clear correction phase. Currently, the coin trades around $0.00001234, down -0.82% for the day, but still above the 50 SMA ($0.00001099) and well above the 100 SMA ($0.00000911), keeping its medium-term trend technically bullish.
We can calculate the rebound zone from the recent swing low near $0.00001000 to the recent high of $0.00001400, which gives us a Fib retracement level of 0.618 around $0.00001138. Interestingly, PEPE respected this level twice in late May, confirming it as a strong support zone.
The 20 SMA ($0.00001318) is still trending downward, so unless PEPE coin price closes above it soon , there's risk of another rejection. Bulls need a daily close above $0.00001350 to gain real confidence and chase higher resistance levels near $0.00001600 and $0.00001800.
For comprehensive exchange comparisons and detailed reviews, visit our exchange comparison guide to find the platform that best suits your altcoin investment needs
Key Levels to Watch and Final Pepe Coin Price Prediction
Short-term, the price remains range-bound. But if PEPE coin price breaks $0.00001275 with volume on the hourly, a test of $0.00001350 on the daily becomes likely. From there, the rally could extend to $0.00001600, which would be a +29% gain from current levels.
Conversely, failure to hold $0.00001220 might open the doors for a fall back to $0.00001100, and a break below that brings $0.00000950 into play—a nearly -25% downside.
With moving averages aligning and price consolidating at key levels, the next 48 hours are critical. A breakout above $0.00001275 signals strength. Until then, caution and tight stop-losses are key.
PEPE coin price is at a decision point . It’s neither a confirmed breakout nor a full crash yet. But the volatility is coming—be ready.
$PEPE, $Pepe
As meme coins battle for spotlight once again, PEPE coin price is showing signs of a potential breakout —or a brewing correction. Let’s dive deep into both the hourly and daily TradingView charts of PEPE coin price to understand whether this rally is just getting started or standing on weak legs.
Pepe Coin Price Prediction: Is PEPE Losing Steam or Building for a Breakout?
PEPE/USD 1 Hr chart- TradingView
On the hourly chart, PEPE coin price is consolidating just under major resistance levels. The price is hovering around $0.00001244, with tight movement over the last 48 hours. What's notable is that the 20 SMA ($0.00001251) is acting as immediate overhead resistance, while 50 SMA ($0.00001229) is closely supporting the current zone. The 200 SMA, however, is still significantly higher around $0.00001275, suggesting that PEPE has room to climb if volume kicks in.
Despite this compression, Heikin Ashi candles are showing mild bullish bias with higher lows, but not enough momentum yet to break through the resistance cluster formed by the 20 and 200 SMAs.
So far, PEPE coin price has gained around +5.75% since bouncing from the support area near $0.00001175, but unless it breaks $0.00001275 convincingly, bulls might not see fireworks.
What Does the Daily Chart Reveal?
PEPE/USD 1 Day chart- TradingView
The daily chart tells a broader story. PEPE coin saw a strong impulse rally in early May, followed by a clear correction phase. Currently, the coin trades around $0.00001234, down -0.82% for the day, but still above the 50 SMA ($0.00001099) and well above the 100 SMA ($0.00000911), keeping its medium-term trend technically bullish.
We can calculate the rebound zone from the recent swing low near $0.00001000 to the recent high of $0.00001400, which gives us a Fib retracement level of 0.618 around $0.00001138. Interestingly, PEPE respected this level twice in late May, confirming it as a strong support zone.
The 20 SMA ($0.00001318) is still trending downward, so unless PEPE coin price closes above it soon , there's risk of another rejection. Bulls need a daily close above $0.00001350 to gain real confidence and chase higher resistance levels near $0.00001600 and $0.00001800.
For comprehensive exchange comparisons and detailed reviews, visit our exchange comparison guide to find the platform that best suits your altcoin investment needs
Key Levels to Watch and Final Pepe Coin Price Prediction
Short-term, the price remains range-bound. But if PEPE coin price breaks $0.00001275 with volume on the hourly, a test of $0.00001350 on the daily becomes likely. From there, the rally could extend to $0.00001600, which would be a +29% gain from current levels.
Conversely, failure to hold $0.00001220 might open the doors for a fall back to $0.00001100, and a break below that brings $0.00000950 into play—a nearly -25% downside.
With moving averages aligning and price consolidating at key levels, the next 48 hours are critical. A breakout above $0.00001275 signals strength. Until then, caution and tight stop-losses are key.
PEPE coin price is at a decision point . It’s neither a confirmed breakout nor a full crash yet. But the volatility is coming—be ready.
$PEPE, $Pepe
Disclaimer: The content of this article solely reflects the author's opinion and does not represent the platform in any capacity. This article is not intended to serve as a reference for making investment decisions.
You may also like
2025 TGE Survival Ranking: Who Will Rise to the Top and Who Will Fall? Complete Grading of 30+ New Tokens, AVICI Dominates S+
The article analyzes the TGE performance of multiple blockchain projects, evaluating project performance using three dimensions: current price versus all-time high, time span, and liquidity-to-market cap ratio. Projects are then categorized into five grades: S, A, B, C, and D. Summary generated by Mars AI This summary was generated by the Mars AI model, and the accuracy and completeness of its content are still being iteratively updated.

Mars Finance | "Machi" increases long positions, profits exceed 10 million dollars, whale shorts 1,000 BTC
Russian households have invested 3.7 billion rubles in cryptocurrency derivatives, mainly dominated by a few large players. INTERPOL has listed cryptocurrency fraud as a global threat. Malicious Chrome extensions are stealing Solana funds. The UK has proposed new tax regulations for DeFi. Bitcoin surpasses $91,000. Summary generated by Mars AI. The accuracy and completeness of this summary are still being iteratively updated by the Mars AI model.

How much is ETH really worth? Hashed provides 10 different valuation methods in one go
After taking a weighted average, the fair price of ETH exceeds $4,700.

Dragonfly partner: Crypto has fallen into financial cynicism, and those valuing public blockchains with PE ratios have already lost
People tend to overestimate what can happen in two years, but underestimate what can happen in ten years.
