Here’s Why Some Analysts See ETH At $3,000 Within A Few Days

Ethereum did not disappoint, but it did not surprise either. The patience of crypto investors has been tested for several weeks. The token fluctuates between consolidation and technical hesitations. However, a spark is brewing. Indicators are converging, flows are tightening, resistances are crumbling. Could the calm be a harbinger of a bullish storm? Crypto traders are waiting for just one signal. And this one might soon emerge.

In brief
- Ethereum remains between $2,500 and $2,800, in a frustrating but structured consolidation.
- Inflows into Ethereum ETFs show growing institutional interest in this strategic token.
- Analysts expect a clear break above $2,800 to confirm a serious bullish trend.
- Ethereum’s on-chain activity is rising sharply, signaling a fundamental recovery beneath the surface.
Ethereum breaks out of the triangle: calm before the pump?
The price of Ethereum has been trapped in a compression zone between $2,500 and $2,800. Every resistance test fails, every pullback attempt is defended. This consolidation pattern, typical of a market in incubation, is starting to tire the players. However, this very fatigue becomes a catalyst.
Long-term moving averages (EMA 34, SMA 200) still support the price, acting as technical flotation lines. Ethereum has never sustainably broken these levels since its post-crypto winter rebound.
The psychological level of $2,800 acts like a dam. In case of a breakout, buyers would take control. This level is watched because it could open a clear path towards $3,000 and beyond. Analyst Ali Martinez tempers expectations:
Wait for a sustained close above $2,750 before becoming bullish on Ethereum. A rejection here could bring the price back down to $2,500, or even $2,380.
In other words, Ethereum is on the threshold . And sometimes a single breath is enough to break a dam.
What the indicators do not shout, but show
Spotlights turn to the market backstage. Ethereum’s network activity has increased continuously since early May. Transactions, new wallets, smart contracts: on-chain signals accumulate. This underlying movement coincides with a rise in flows toward Ethereum ETFs.
@TedPillows sums up the situation on X:
ETH is still consolidating after a bullish May. ETF inflows are increasing and network activity is intensifying.
Two synchronous drivers: fundamentals feed the technical.
Weekly resistances at $2,800 are robust. They form a double wall: SMA 50 and SMA 100, levels feared by traders. But what differentiates a peak from a ceiling is pressure. And pressure is rising.
Every day without a breakout is a day when the probability of a breakout increases. Momentum indicators are not shouting yet, but their movements are aligning. It is often in silence that major crypto bullish phases begin.
Ethereum, target $3,000: a promise or a trap?
A break above $2,800 would not be trivial. It would be a cycle break. It would open a tunnel to little-tested, therefore little-defended resistances. This tunnel leads to $3,000, or even more.
Here is what the key figures of the moment reveal:
- $2,800: triple resistance level (psychological, technical, weekly);
- $2,500: strong support level, base of recent rallies;
- $1.2 billion: estimated value of inflows into Ethereum ETFs in the last 30 days;
- +18%: growth of ETH on-chain activity over the last month;
- 170%: Ethereum performance since its 2022 low.
Ethereum could play spoiler in a market still largely dominated by Bitcoin. And if the $3,000 breakthrough is confirmed, altcoins will follow. The domino effect of crypto markets is known: what starts on Ethereum often ends across the entire secondary token galaxy.
One thing is sure: Ethereum is no longer alone at the starting line. Bitcoin has just broken $110,000 , flirting with its all-time high. Euphoria is sweeping the crypto markets. And in this context, Ethereum becomes the missing piece of the puzzle. The market’s gaze is fixed on it. Every candle is now a vote. Every close, a direction.
Disclaimer: The content of this article solely reflects the author's opinion and does not represent the platform in any capacity. This article is not intended to serve as a reference for making investment decisions.
You may also like
Coinpedia Digest: This Week’s Crypto News Highlights | 29th November, 2025
QNT Price Breaks Falling Wedge: Can the Bullish Structure Push Toward $150?

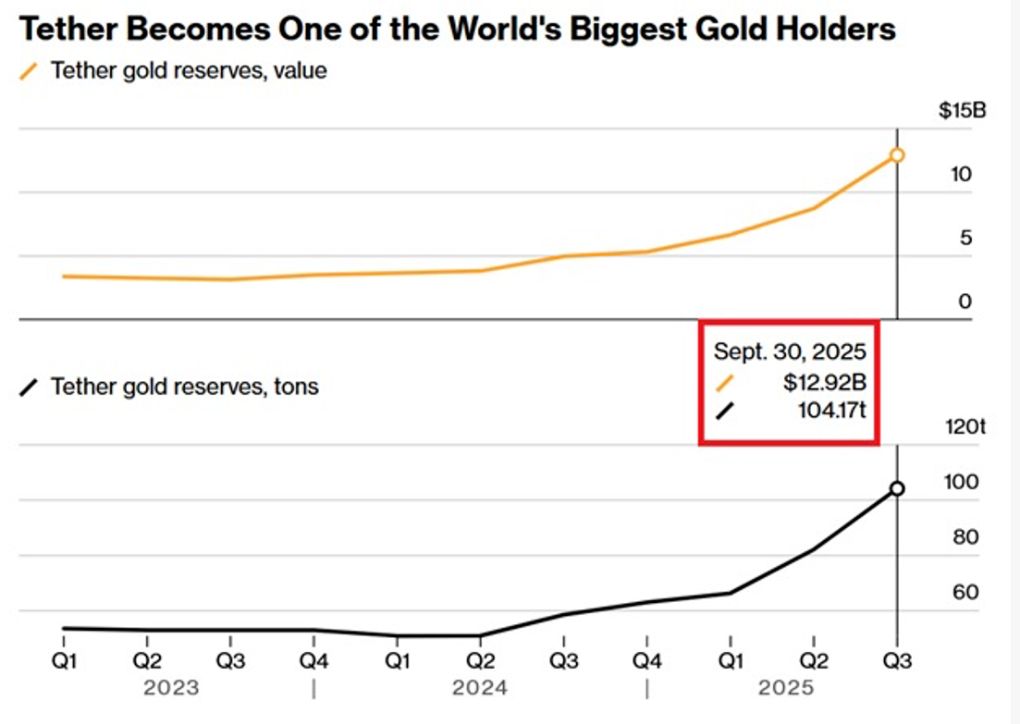
Digital dollar hoards gold, Tether's vault is astonishing!
The Crypto Bloodbath Stalls: Is a Bottom In?