TRON Price Prediction: Next Stop $0.25 or $0.30?

TRON (TRX) price is experiencing a sharp pullback after an impressive rally that recently took it near the $0.30 mark. As of now, TRX price is trading around $0.273 on the hourly chart and $0.271 on the daily chart, reflecting a loss of bullish momentum. This correction comes after price rejection near resistance levels and a breakdown below short-term moving averages. But is this a healthy retracement or the start of a deeper decline?
Tron Price Prediction: Is the Rebound Attempt Strong Enough?
 TRX/USD 1 Hr Chart- TradingView
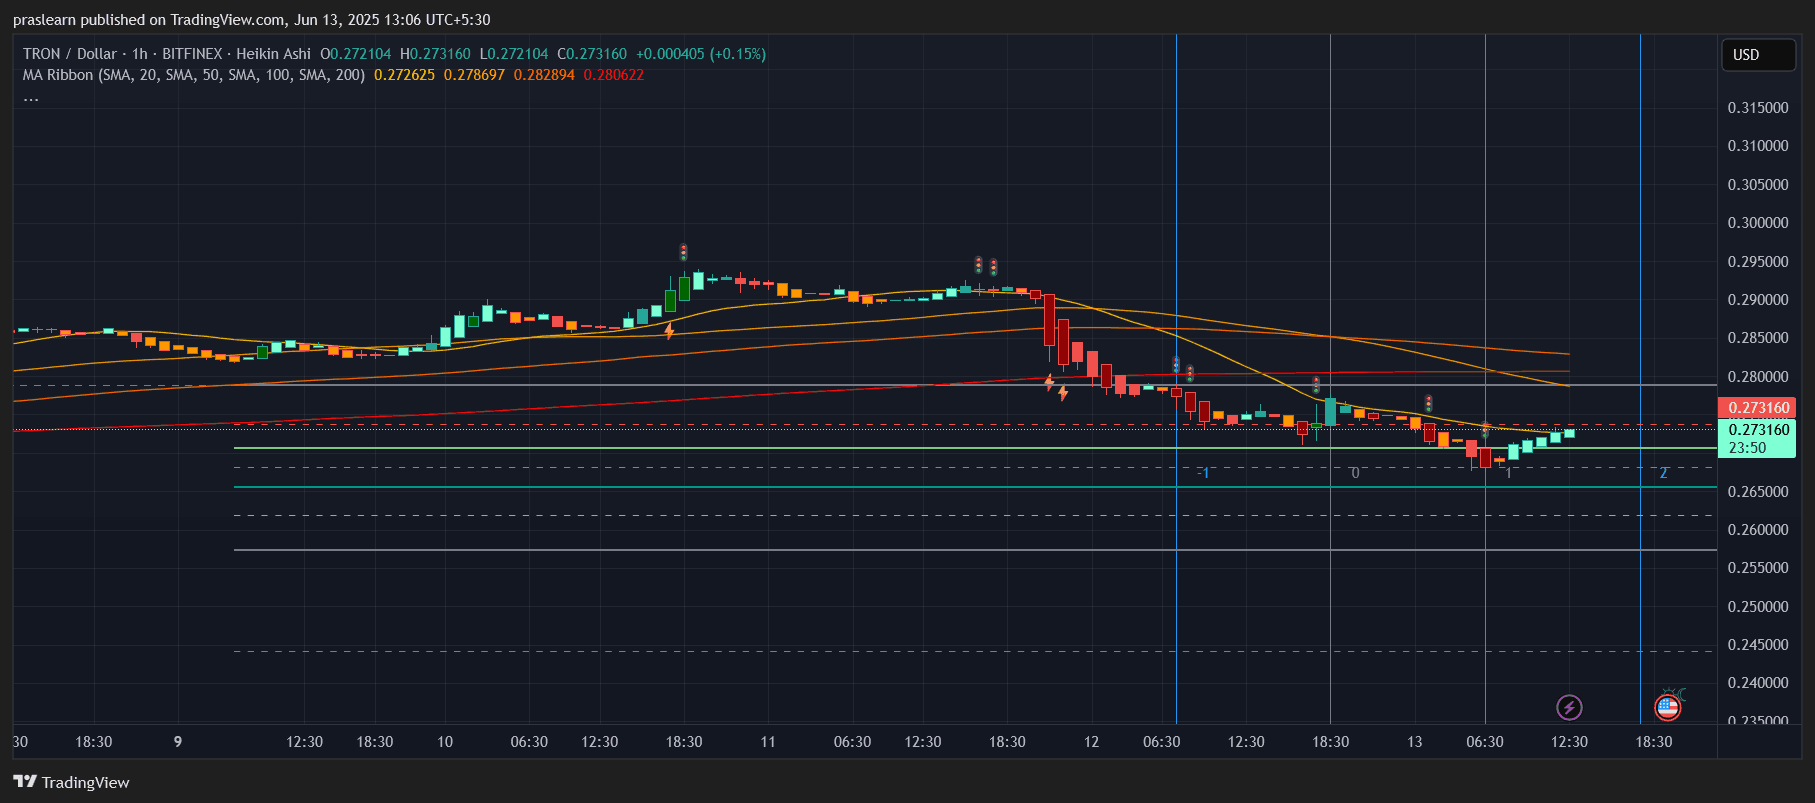
The 1-hour Heikin Ashi chart shows that TRX price dropped significantly from $0.29 to a recent low near $0.265 , followed by a weak bounce to $0.273. The price remains below the 20, 50, and 100-period SMAs, which cluster near $0.278–$0.282, creating a heavy resistance zone. This cluster is acting as a “ceiling,” capping any short-term upside attempts.
TRX briefly showed a bullish engulfing pattern near the $0.265 support, which triggered a few green candles, but volume remained subdued. For a real bounce to occur, TRX must reclaim $0.278 quickly. Until then, this recovery looks like a dead cat bounce rather than a bullish reversal.
A Fibonacci retracement from the local high of $0.29 to the low of $0.265 shows the 38.2% level at $0.274 and the 50% level near $0.278—precisely where the SMAs are pressing down. Unless Tron price breaks above these with strong volume, further downside to $0.260 is likely.
Daily Chart: Was the Rally Overextended?
 TRX/USD 1 Day Chart- TradingView
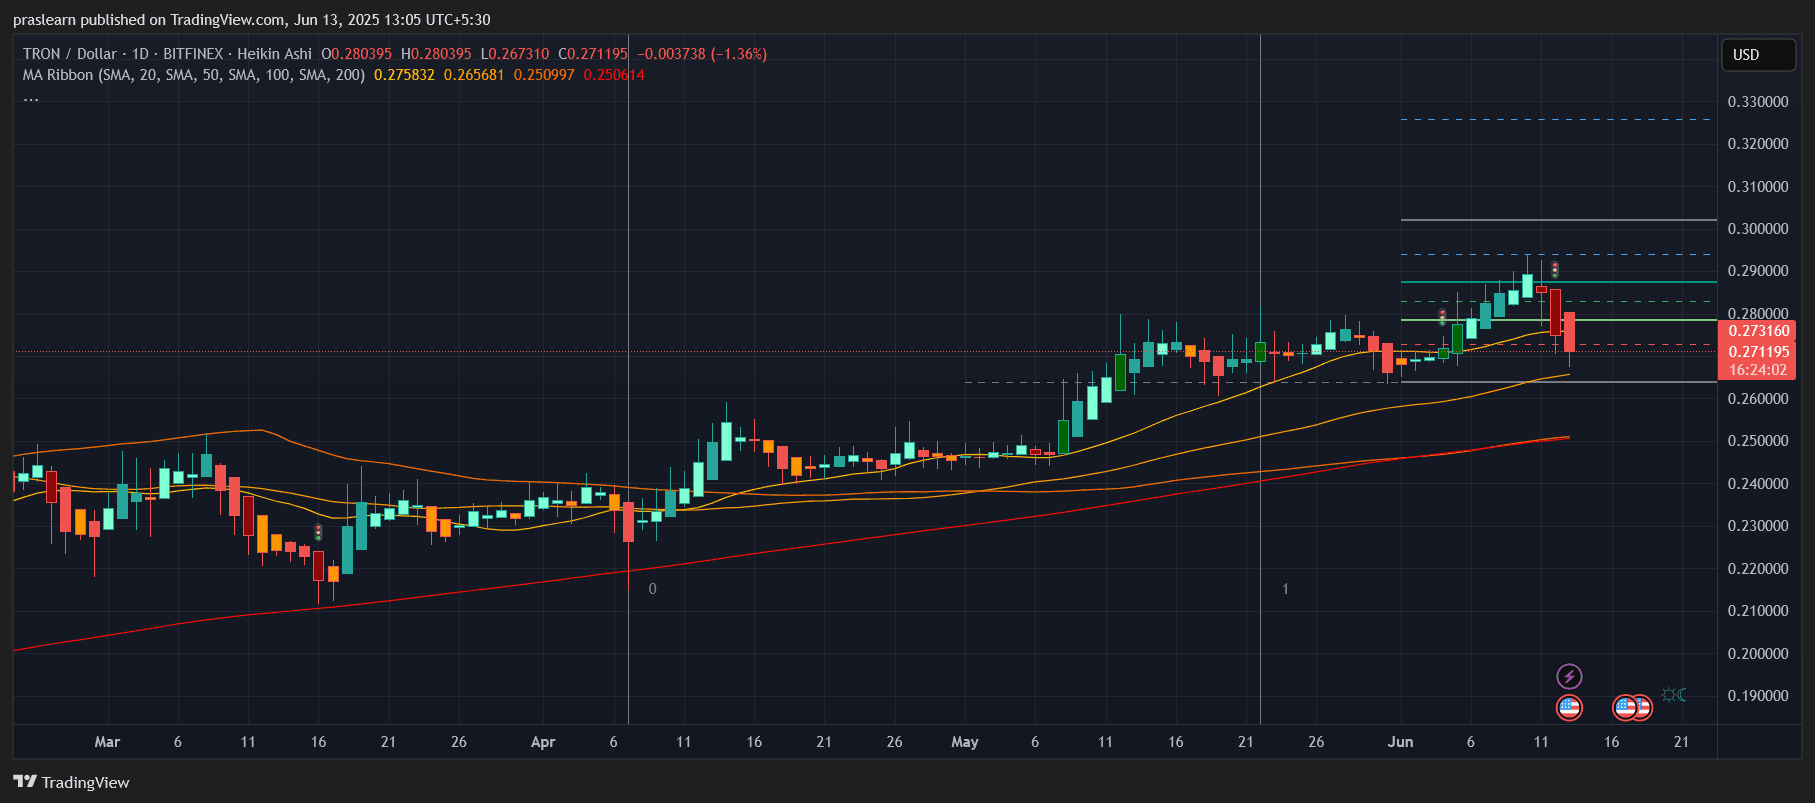
The daily chart puts things in perspective. After a strong uptrend from $0.24 to $0.29 in early June, TRX price faced rejection at the $0.295–$0.300 resistance zone. The red candle on June 12 was a clear bearish engulfing pattern, signaling a trend reversal. Price is now testing the 50-day SMA around $0.266, a key support level.
Tron price had been riding above its 20-day and 50-day moving averages for several weeks, indicating bullish momentum. But with the breakdown below the 20-day SMA ($0.2758), the sentiment has clearly shifted. If TRX closes below the 50-day SMA, we could see a move toward $0.250 in the coming sessions.
However, if buyers defend $0.265 successfully and reclaim $0.280 in the next few days, the structure of the uptrend might remain intact. The RSI on the daily chart has dipped but is still above the oversold zone, suggesting there’s still time for bulls to regroup.
Is TRON Price Still in a Bull Market?
Let’s consider some quick math. TRX price has corrected about 6.5% from its recent high of $0.29 to $0.271. In past cycles, TRX typically pulls back 8–12% after a strong rally before resuming upward. A 10% correction from $0.29 would bring it to $0.261—a level very close to the 50-day SMA.
So if $0.261–$0.265 holds, Tron price could stabilize and resume its uptrend. But if that zone breaks, the price could dive another 5% toward $0.250, where the 100-day SMA sits.
What’s the Tron Price Prediction for This Week?
If TRX price breaks and holds above $0.278 , the first bullish target is $0.285 and then a retest of $0.295. On the flip side, if it drops below $0.265, the next key support is $0.250. This week will be critical as Tron price decides whether to form a higher low and continue the uptrend—or sink into a bearish phase.
Given the current technical setup, the probability of sideways consolidation between $0.265 and $0.280 is higher unless a macro catalyst pushes crypto prices broadly.
Conclusion: Buy the Dip or Wait It Out?
Traders should watch the $0.265–$0.280 range closely. A clean breakout above $0.280 with volume would confirm bullish strength, while a breakdown below $0.265 may invite more selling pressure. For now, TRON price looks like it's entering a consolidation phase after an overheated rally. A clear direction should emerge in the next 48 hours.
$TRX, $Tron
TRON (TRX) price is experiencing a sharp pullback after an impressive rally that recently took it near the $0.30 mark. As of now, TRX price is trading around $0.273 on the hourly chart and $0.271 on the daily chart, reflecting a loss of bullish momentum. This correction comes after price rejection near resistance levels and a breakdown below short-term moving averages. But is this a healthy retracement or the start of a deeper decline?
Tron Price Prediction: Is the Rebound Attempt Strong Enough?
TRX/USD 1 Hr Chart- TradingView
The 1-hour Heikin Ashi chart shows that TRX price dropped significantly from $0.29 to a recent low near $0.265 , followed by a weak bounce to $0.273. The price remains below the 20, 50, and 100-period SMAs, which cluster near $0.278–$0.282, creating a heavy resistance zone. This cluster is acting as a “ceiling,” capping any short-term upside attempts.
TRX briefly showed a bullish engulfing pattern near the $0.265 support, which triggered a few green candles, but volume remained subdued. For a real bounce to occur, TRX must reclaim $0.278 quickly. Until then, this recovery looks like a dead cat bounce rather than a bullish reversal.
A Fibonacci retracement from the local high of $0.29 to the low of $0.265 shows the 38.2% level at $0.274 and the 50% level near $0.278—precisely where the SMAs are pressing down. Unless Tron price breaks above these with strong volume, further downside to $0.260 is likely.
Daily Chart: Was the Rally Overextended?
TRX/USD 1 Day Chart- TradingView
The daily chart puts things in perspective. After a strong uptrend from $0.24 to $0.29 in early June, TRX price faced rejection at the $0.295–$0.300 resistance zone. The red candle on June 12 was a clear bearish engulfing pattern, signaling a trend reversal. Price is now testing the 50-day SMA around $0.266, a key support level.
Tron price had been riding above its 20-day and 50-day moving averages for several weeks, indicating bullish momentum. But with the breakdown below the 20-day SMA ($0.2758), the sentiment has clearly shifted. If TRX closes below the 50-day SMA, we could see a move toward $0.250 in the coming sessions.
However, if buyers defend $0.265 successfully and reclaim $0.280 in the next few days, the structure of the uptrend might remain intact. The RSI on the daily chart has dipped but is still above the oversold zone, suggesting there’s still time for bulls to regroup.
Is TRON Price Still in a Bull Market?
Let’s consider some quick math. TRX price has corrected about 6.5% from its recent high of $0.29 to $0.271. In past cycles, TRX typically pulls back 8–12% after a strong rally before resuming upward. A 10% correction from $0.29 would bring it to $0.261—a level very close to the 50-day SMA.
So if $0.261–$0.265 holds, Tron price could stabilize and resume its uptrend. But if that zone breaks, the price could dive another 5% toward $0.250, where the 100-day SMA sits.
What’s the Tron Price Prediction for This Week?
If TRX price breaks and holds above $0.278 , the first bullish target is $0.285 and then a retest of $0.295. On the flip side, if it drops below $0.265, the next key support is $0.250. This week will be critical as Tron price decides whether to form a higher low and continue the uptrend—or sink into a bearish phase.
Given the current technical setup, the probability of sideways consolidation between $0.265 and $0.280 is higher unless a macro catalyst pushes crypto prices broadly.
Conclusion: Buy the Dip or Wait It Out?
Traders should watch the $0.265–$0.280 range closely. A clean breakout above $0.280 with volume would confirm bullish strength, while a breakdown below $0.265 may invite more selling pressure. For now, TRON price looks like it's entering a consolidation phase after an overheated rally. A clear direction should emerge in the next 48 hours.
$TRX, $Tron
Disclaimer: The content of this article solely reflects the author's opinion and does not represent the platform in any capacity. This article is not intended to serve as a reference for making investment decisions.
You may also like
$8.8 billion outflow countdown: MSTR is becoming the abandoned child of global index funds
The final result will be revealed on January 15, 2026, and the market has already started to vote with its feet.
Deconstructing DAT: Beyond mNAV, How to Identify "Real vs. Fake HODLing"?
There is only one iron rule for investing in DAT: ignore premium bubbles and only invest in those with a genuine flywheel of continuously increasing "crypto per share."

Empowered by AI Avatars, How Does TwinX Create Immersive Interaction and a Value Closed Loop?
1. **Challenges in the Creator Economy**: Web2 content platforms suffer from issues such as opaque algorithms, non-transparent distribution, unclear commission rates, and high costs for fan migration, making it difficult for creators to control their own data and earnings. 2. **Integration of AI and Web3**: The development of AI technology, especially AI Avatar technology, combined with Web3's exploration of the creator economy, offers new solutions aimed at breaking the control of centralized platforms and reconstructing content production and value distribution. 3. **Positioning of the TwinX Platform**: TwinX is an AI-driven Web3 short video social platform that aims to reconstruct content, interaction, and value distribution through AI avatars, immersive interactions, and a decentralized value system, enabling creators to own their data and income. 4. **Core Features of TwinX**: These include AI avatar technology, which allows creators to generate a learnable, configurable, and sustainably operable "second persona", as well as a closed-loop commercialization pathway that integrates content creation, interaction, and monetization. 5. **Web3 Characteristics**: TwinX embodies the assetization and co-governance features of Web3. It utilizes blockchain to confirm and record interactive behaviors, turning user activities into traceable assets, and enables participants to engage in platform governance through tokens, thus integrating the creator economy with community governance.

Aster CEO explains in detail the vision of Aster privacy L1 chain, reshaping the decentralized trading experience
Aster is set to launch a privacy-focused Layer 1 (L1) public chain, along with detailed plans for token empowerment, global market expansion, and liquidity strategies.