Everyone Expects PI Price to Crash—but Hidden RSI Divergence Hints at Surprise Reversal

The Pi coin looks like it’s collapsing. However, a hidden divergence between PI price and momentum suggests otherwise.
As exchange inflows rise and traders pile into shorts, a quiet reversal pattern is forming.
Exchange-Based Caution Remains High
Pi coin’s exchange reserves have significantly surged over the past two months, with recent spikes showing large inflows to trading platforms. This typically indicates that holders are preparing to sell, not hold.
The most recent table shows exchange net inflows outweighing outflows across major CEXs. That’s a caution flag for bulls.

Funding Rates Stay Deep in Negative Territory
Funding rates on PI perpetual contracts are still firmly negative. That means traders holding long positions are being paid by those shorting PI, a sign that bearish conviction is high.

Funding Rate reflects the cost of holding long vs. short positions in perpetual futures. A negative reading indicates traders are mostly short and paying to maintain bearish exposure.
Weak Bulls, But No Capitulation Yet
The Elder Ray Index paints a confusing picture. Bulls remain mostly muted, and Bear Power is still showing consistent red bars. Yet, these bars are without fresh spikes, a trend that might just lead to some optimism.

The Elder Ray Index is used to measure the strength of buyers and sellers by comparing price action to an exponential moving average. In PI’s case, the bulls are struggling to sustain momentum.
Still, the absence of new bear surges hints at a standoff, not a breakdown yet.
Hidden Bullish Divergence Gives Bulls a Slim Hope
The one glimmer of optimism comes from the Relative Strength Index (RSI). While PI’s price has made consecutive lower lows, RSI has been printing higher lows, a textbook hidden bullish divergence. This often signals that bearish pressure is weakening, even if the price hasn’t reacted yet.

The Relative Strength Index tracks momentum. When price falls but RSI rises, a hidden bullish divergence occurs, often a sign of an upcoming reversal.
If this divergence plays out, the key resistance zones lie at $0.4797 and $0.5152. A confirmed breakout above those levels could open a path toward $0.60. The Fibonacci indicator drawn from the most pronounced swing low to the last prominent swing high gives additional resistance levels at $0.5037, $0.5347, and $0.5657.

The Fibonacci indicator, drawn from key price swings, maps potential support and resistance levels based on proportional retracement zones.
However, if the PI price breaks below the $0.4035 support zone, the entire bullish thesis collapses, likely dragging PI into a deeper correction.
Disclaimer: The content of this article solely reflects the author's opinion and does not represent the platform in any capacity. This article is not intended to serve as a reference for making investment decisions.
You may also like
Canton token CC to be listed, US CPI may be absent for the first time
Subscribe with one click to stay updated on the most noteworthy industry events and major project developments in the coming week, and keep your finger on the pulse of the market anytime, anywhere.

Trump's "Bitcoin Superpower" Plan: America's Monetary Hegemony Is Entering a New Crypto Phase

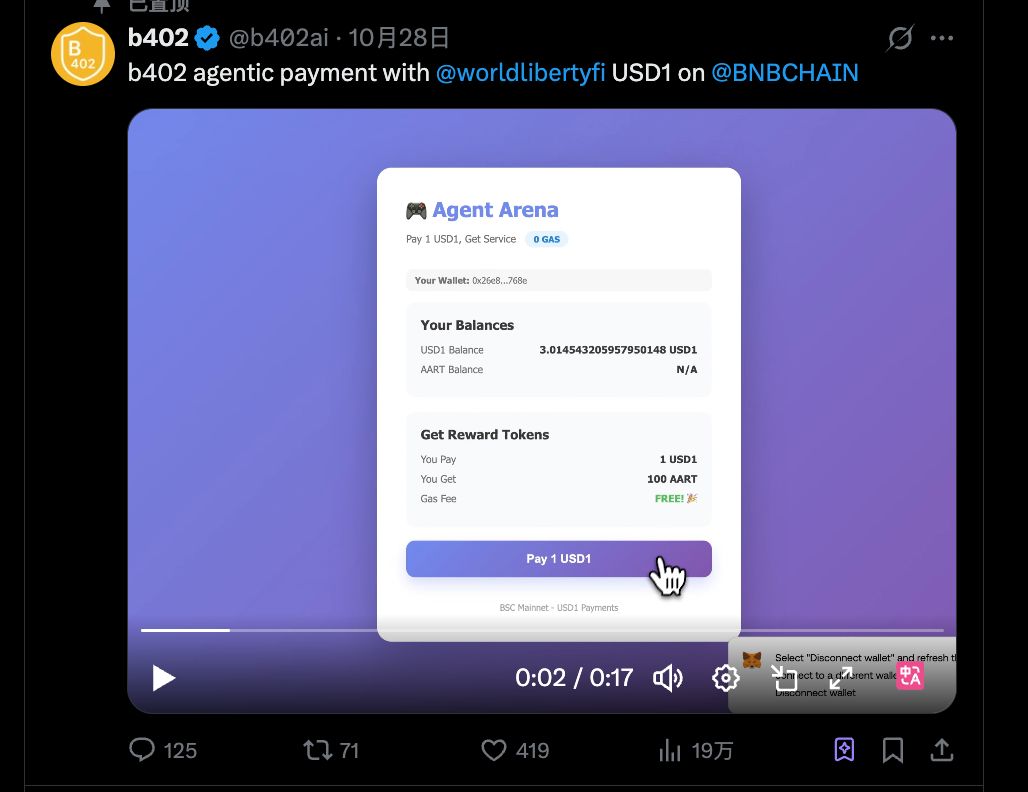
Interpretation of b402: From AI Payment Protocol to Service Marketplace, BNBChain's Infrastructure Ambitions
b402 is not just an alternative to x402 on BSC; it could be the starting point for a much bigger opportunity.
Shutdown Leaves Fed Without Key Data as Job Weakness Deepens