Solana Becomes The Talk Of Social Media As Price Hits $200

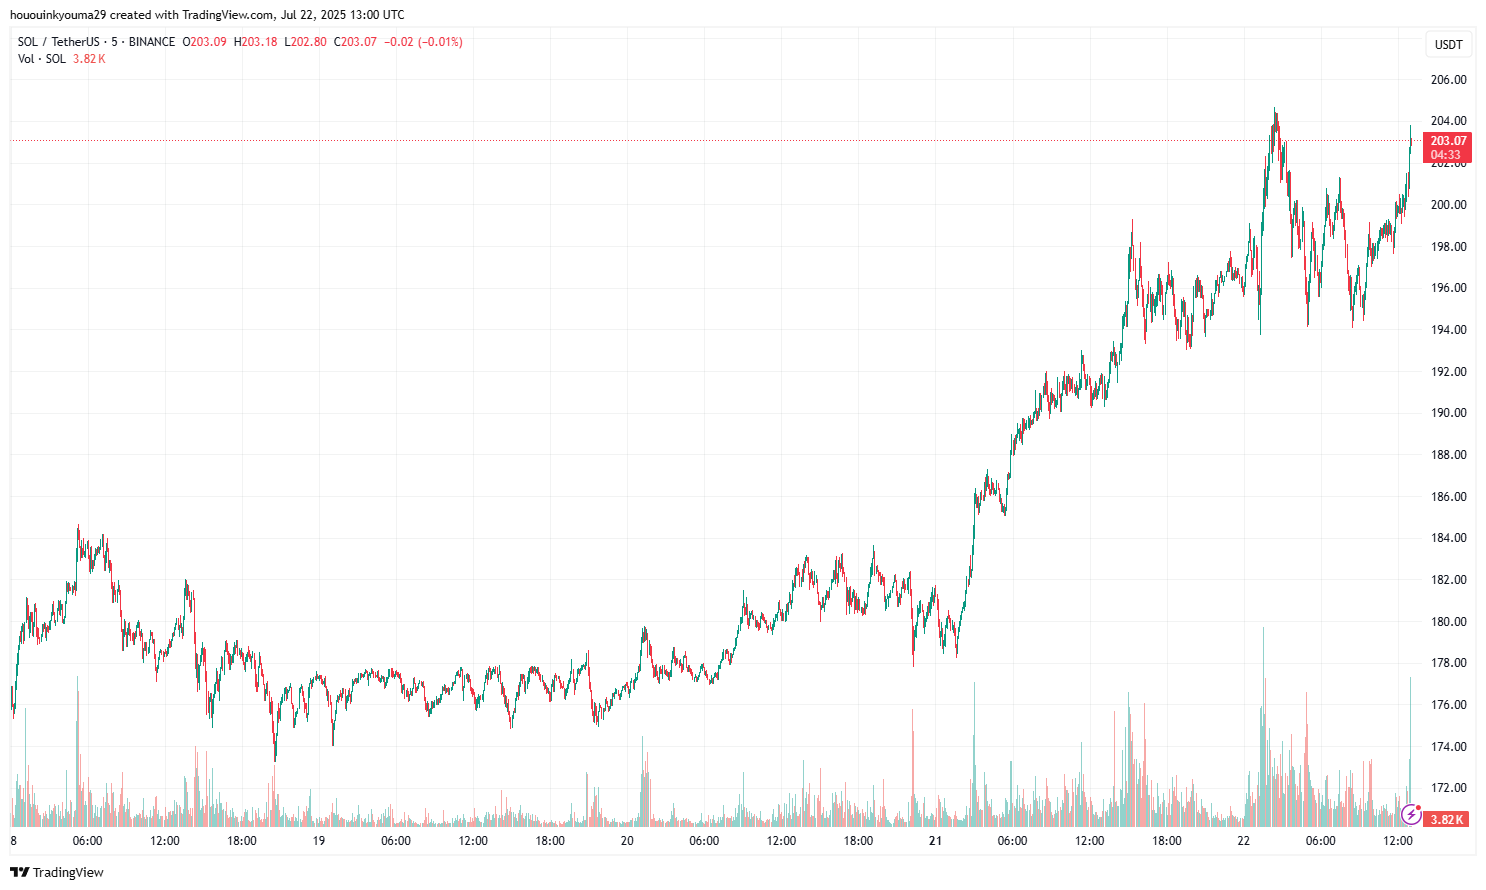
Solana (SOL) has crossed the $200 mark for the first time in months, sparking a frenzy of discussion across major social media platforms.
Solana Social Dominance Has Spiked To Highest Since Early June
In a new post on X, analytics firm Santiment has talked about how the crowd has reacted to the latest rally in Solana’s price. The metric of relevance here is the “Social Dominance,” which tells us about the degree of attention that a given coin is receiving on social media relative to the top 100 cryptocurrencies by market cap.
The indicator is based on another, known as the Social Volume. The Social Volume measures the unique number of posts/messages/threads on these platforms that are making mentions of the asset.
The Social Dominance takes the Social Volume of a coin and calculates what percentage of the combined Social Volume of the hundred largest assets in the sector that it makes up for.
Below is the chart shared by Santiment that shows the trend in the indicator for Solana over the last few months: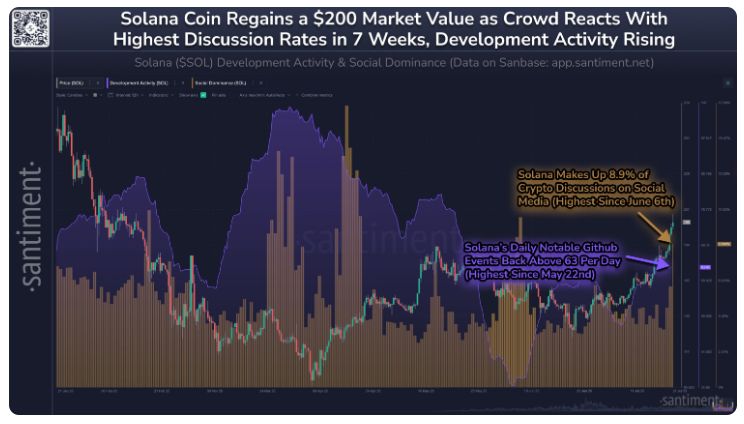
As displayed in the above graph, the Solana Social Dominance has just witnessed a sharp increase, indicating that interest in the asset has surged among social media users. The spike in attention toward SOL has come following a notable rally in its price, which has taken it past the $200 level for the first time since early 2025. The asset now makes up for 8.9% of all cryptocurrency-related discussions, the highest since June 6th.
Though while some market interest can be positive, an excess of it has generally proven to be a bearish sign in the past. As such, the spike in the Social Dominance of the coin may be something to keep an eye on, as FOMO developing among the crowd could potentially impede the price run.
In the same chart, the analytics firm has also attached the data for another Solana indicator: Development Activity. This metric measures, as its name suggests, the total amount of work that the developers of the project are putting in on its public GitHub repositories.
The indicator gauges development work in terms of ‘events,’ where an event is any action made by the developer on the repository, like the push of a commit or the creation of a fork.
From the graph, it’s visible that the Development Activity of Solana has witnessed a rise recently and has climbed back above 63 events per day. This is the highest value for the metric since May 22nd. Thus, it would appear that the developers of the project are ramping up their effort alongside the price surge.
SOL Price
At the time of writing, Solana is floating around $203, up more than 27% in the last seven days.
Disclaimer: The content of this article solely reflects the author's opinion and does not represent the platform in any capacity. This article is not intended to serve as a reference for making investment decisions.
You may also like
Economic Truth: AI Drives Growth Alone, Cryptocurrency Becomes a Political Asset
The article analyzes the current economic situation, pointing out that AI is the main driver of GDP growth, while other sectors such as the labor market and household finances are in decline. Market dynamics have become detached from fundamentals, with AI capital expenditure being key to avoiding a recession. The widening wealth gap and energy supply are becoming bottlenecks for AI development. In the future, AI and cryptocurrencies may become the focus of policy adjustments. Summary generated by Mars AI This summary was generated by the Mars AI model, and its accuracy and completeness are still in the process of iterative improvement.
AI unicorn Anthropic accelerates IPO push, taking on OpenAI head-to-head?
Anthropic is accelerating its expansion into the capital markets, initiating collaboration with top law firms, which is seen as an important signal toward going public. The company's valuation is approaching 300 billions USD, and investors are betting it could go public before OpenAI.
Did top universities also get burned? Harvard invested $500 million heavily in bitcoin right before the major plunge
Harvard University's endowment fund significantly increased its holdings in bitcoin ETFs to nearly 500 million USD in the previous quarter. However, in the current quarter, the price of bitcoin subsequently dropped by more than 20%, exposing the fund to significant timing risk.

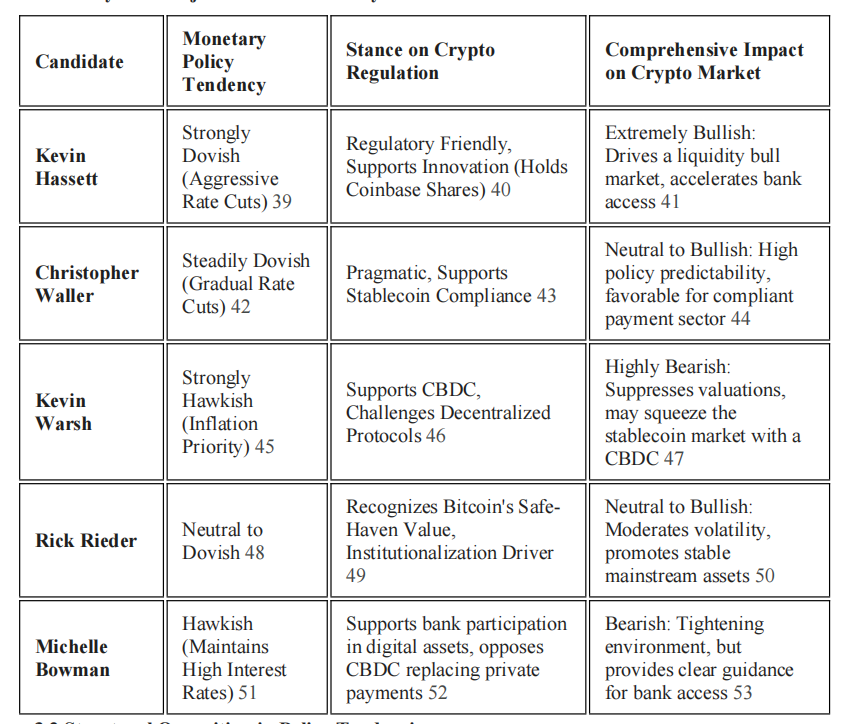
The Structural Impact of the Next Federal Reserve Chair on the Cryptocurrency Industry: Policy Shifts and Regulatory Reshaping
The change of the next Federal Reserve Chair is a decisive factor in reshaping the future macro environment of the cryptocurrency industry.