Dogecoin (DOGE) Price Prediction for August 12

Today, the price of Dogecoin is $0.2352. The price is getting tighter in a pattern made by rising lows and a cap that goes back to the peak in November 2024. At $0.2150, buyers leaned on the 0.236 Fib mark and forced a nice rebound that has now stopped below $0.2455 to $0.2460. Clear that pocket, and the move points to $0.2668 on the Fib grid.
Dogecoin Price Forecast Table: August 12, 2025
| Indicator/Zone | Level / Signal |
| Current price | $0.2352 |
| Resistance 1 | $0.2397 (triangle top) |
| Resistance 2 | $0.2455 (Bollinger upper) |
| Stretch target | $0.2668 (Fib 0.382) |
| Support 1 | $0.2233 (EMA50) |
| Support 2 | $0.2150 (Fib 0.236) |
| EMA20 / EMA50 / EMA100 / EMA200 (4H) | $0.2314 / $0.2233 / $0.2206 / $0.2151 |
| Bollinger Bands (4H) | Upper $0.2455 / Mid $0.2336 / Lower $0.2217 |
| VWAP (30 min) | $0.2353 |
| Supertrend (4H) | Bullish above $0.2252 |
| DMI (+DI / -DI / ADX) | 23.15 / 12.05 / 42.24 |
| Spot netflow (Aug 11) | +$2.09M |
| Key demand zone | $0.16 to $0.15 |
| Liquidity targets | $0.2668 / $0.2865 |
What’s Happening With Dogecoin’s Price?
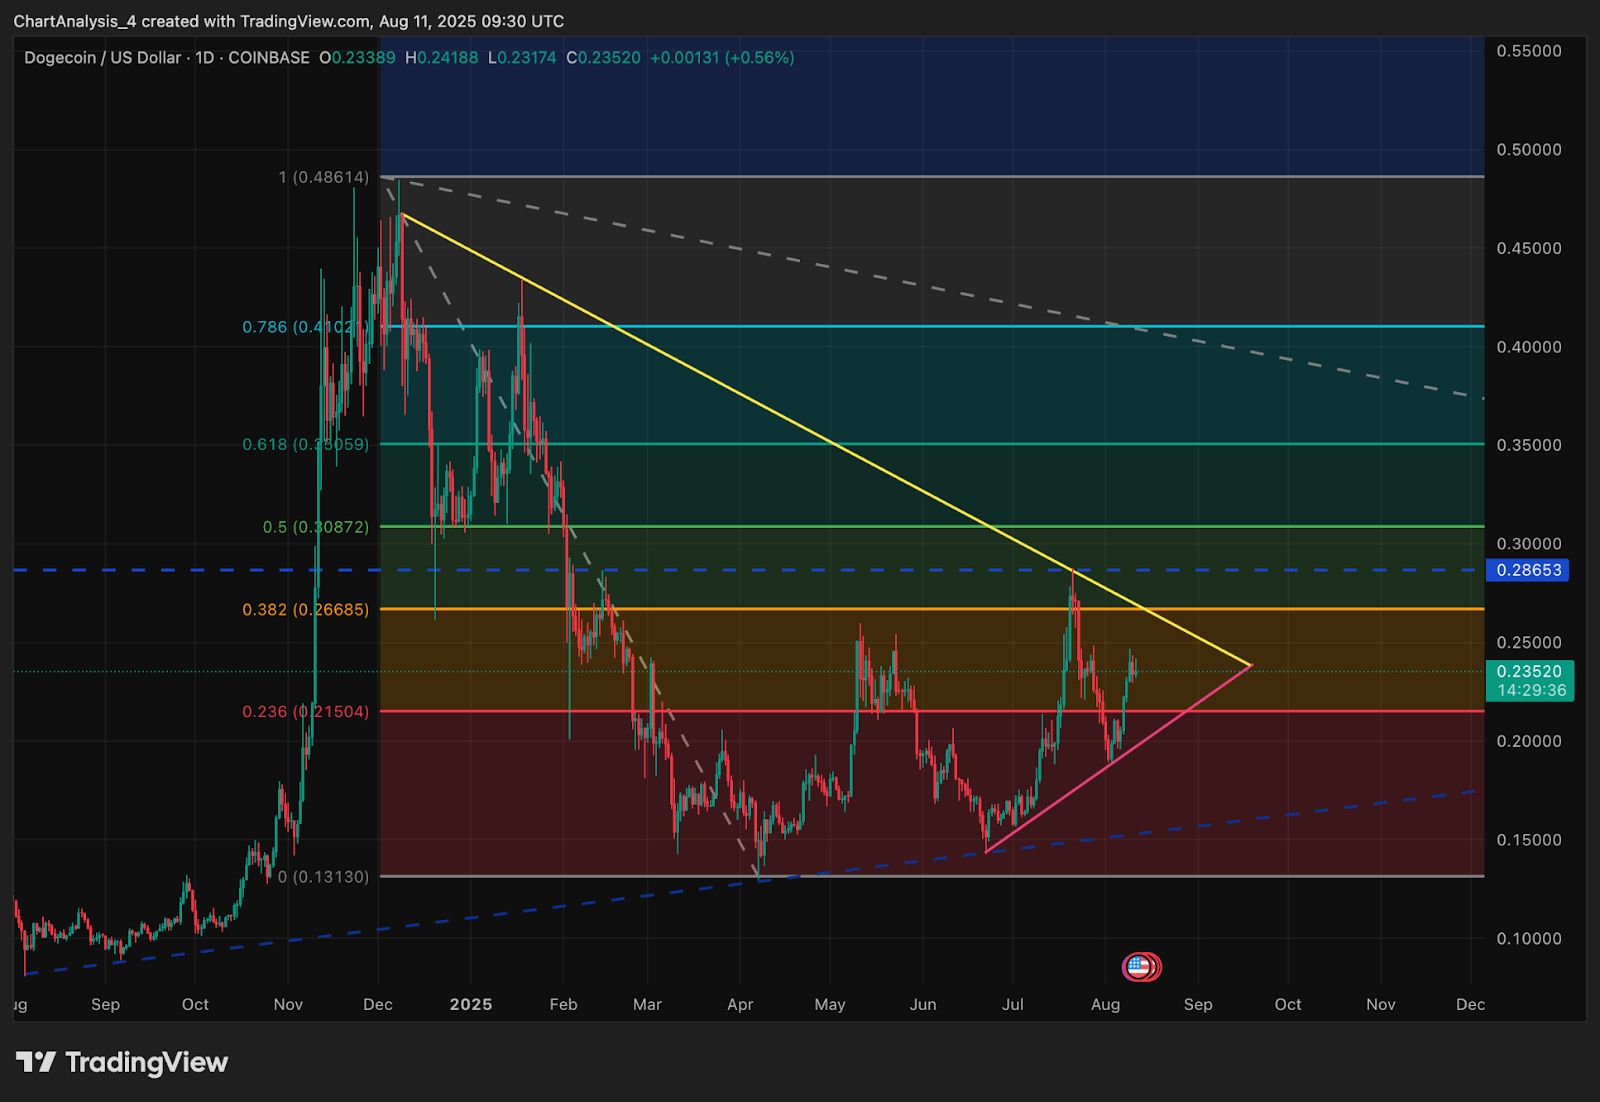
DOGE trades between the 0.236 level at $0.2150 and the 0.382 mark at $0.2668 on the daily view. This is inside a longer-term triangle. If the price closes above the downtrend line drawn from $0.4861 every day, the bias for the higher time frame will shift back to continuation.
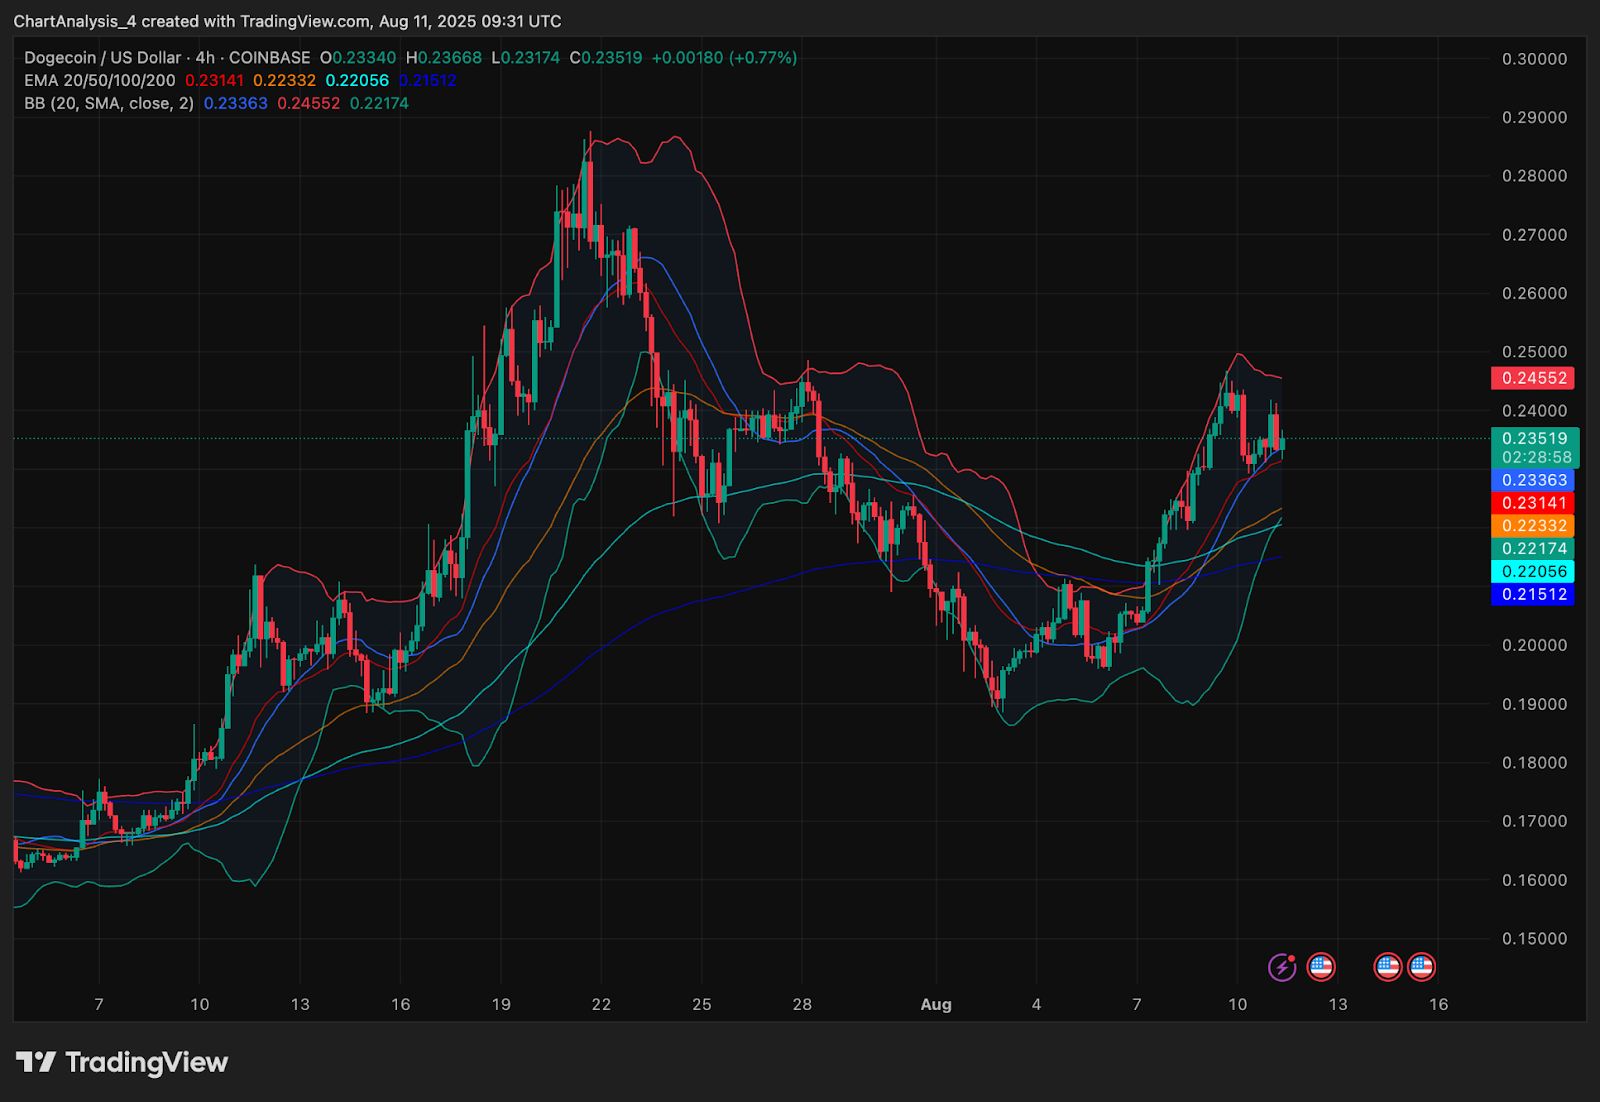
The 4-hour setup is good. DOGE is trading above the EMA20 at $0.2314, the EMA50 at $0.2233, the EMA100 at $0.2206, and the EMA200 at $0.2151. The Bollinger Bands are now closer together. The upper band at $0.2455 is a short-term resistance level, and the lower band at $0.2217 is the first support level.
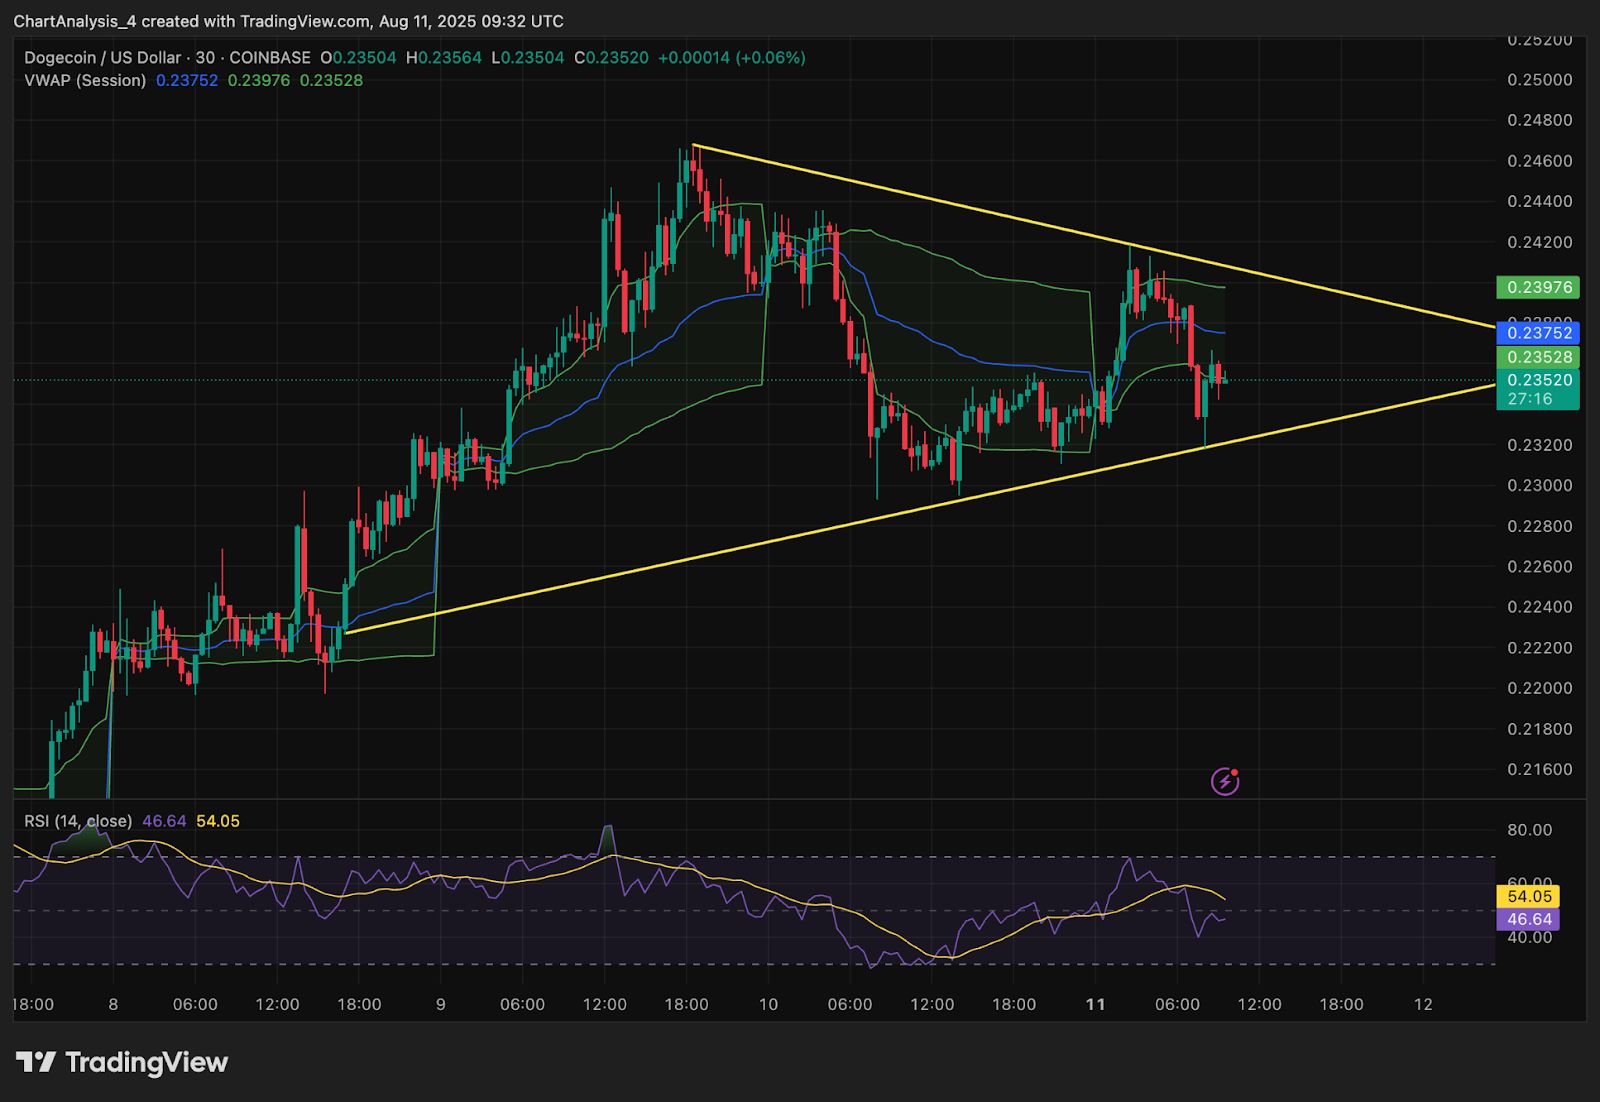
Drop to the 30 minute view and you see price coiling between VWAP at $0.2353 and an intraday channel lid at $0.2397. RSI sits at 54.05 after easing from overbought, which keeps momentum constructive without stretch.
Dogecoin Price Analysis: Order Flow and Liquidity
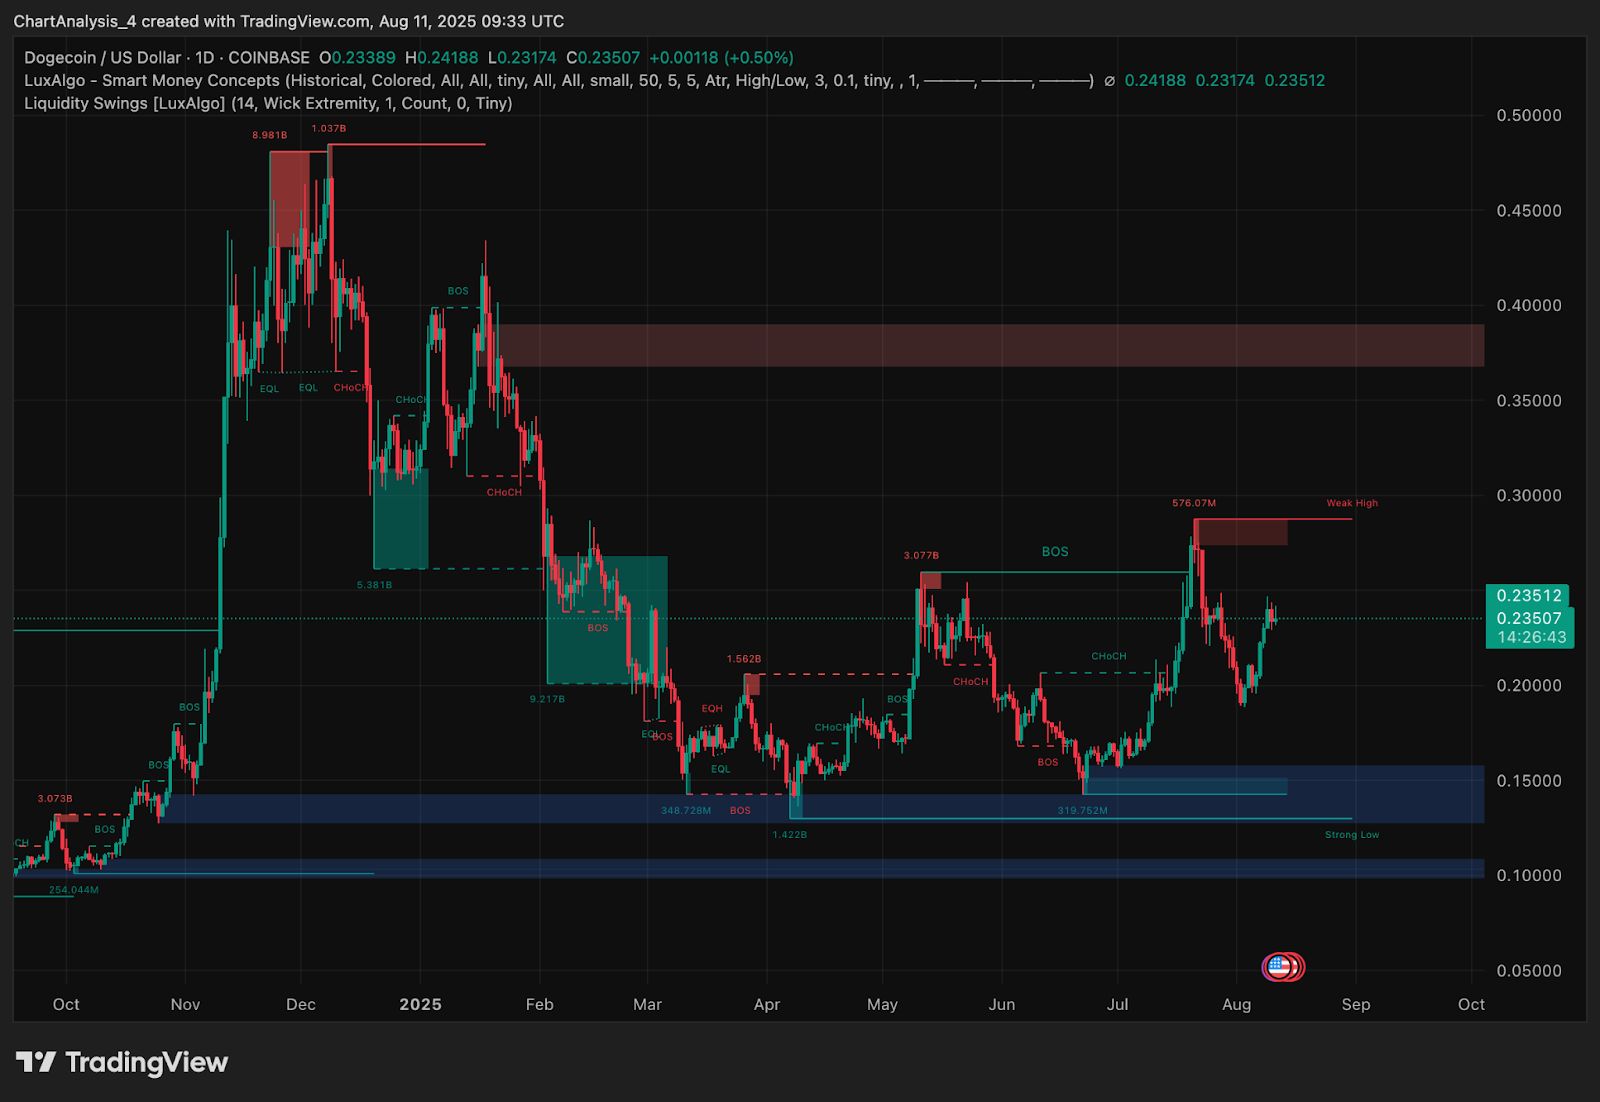
Daily Smart Money Concepts work showed a Break of Structure over $0.22 in early August. Then the price moved toward $0.30 but was turned away inside a supply pocket between $0.29 and $0.30. After a triangle break, that band is still the first big goal. For downside risk, firmer demand is between $0.16 and $0.15, with a stronger base near the $0.10 strong low.
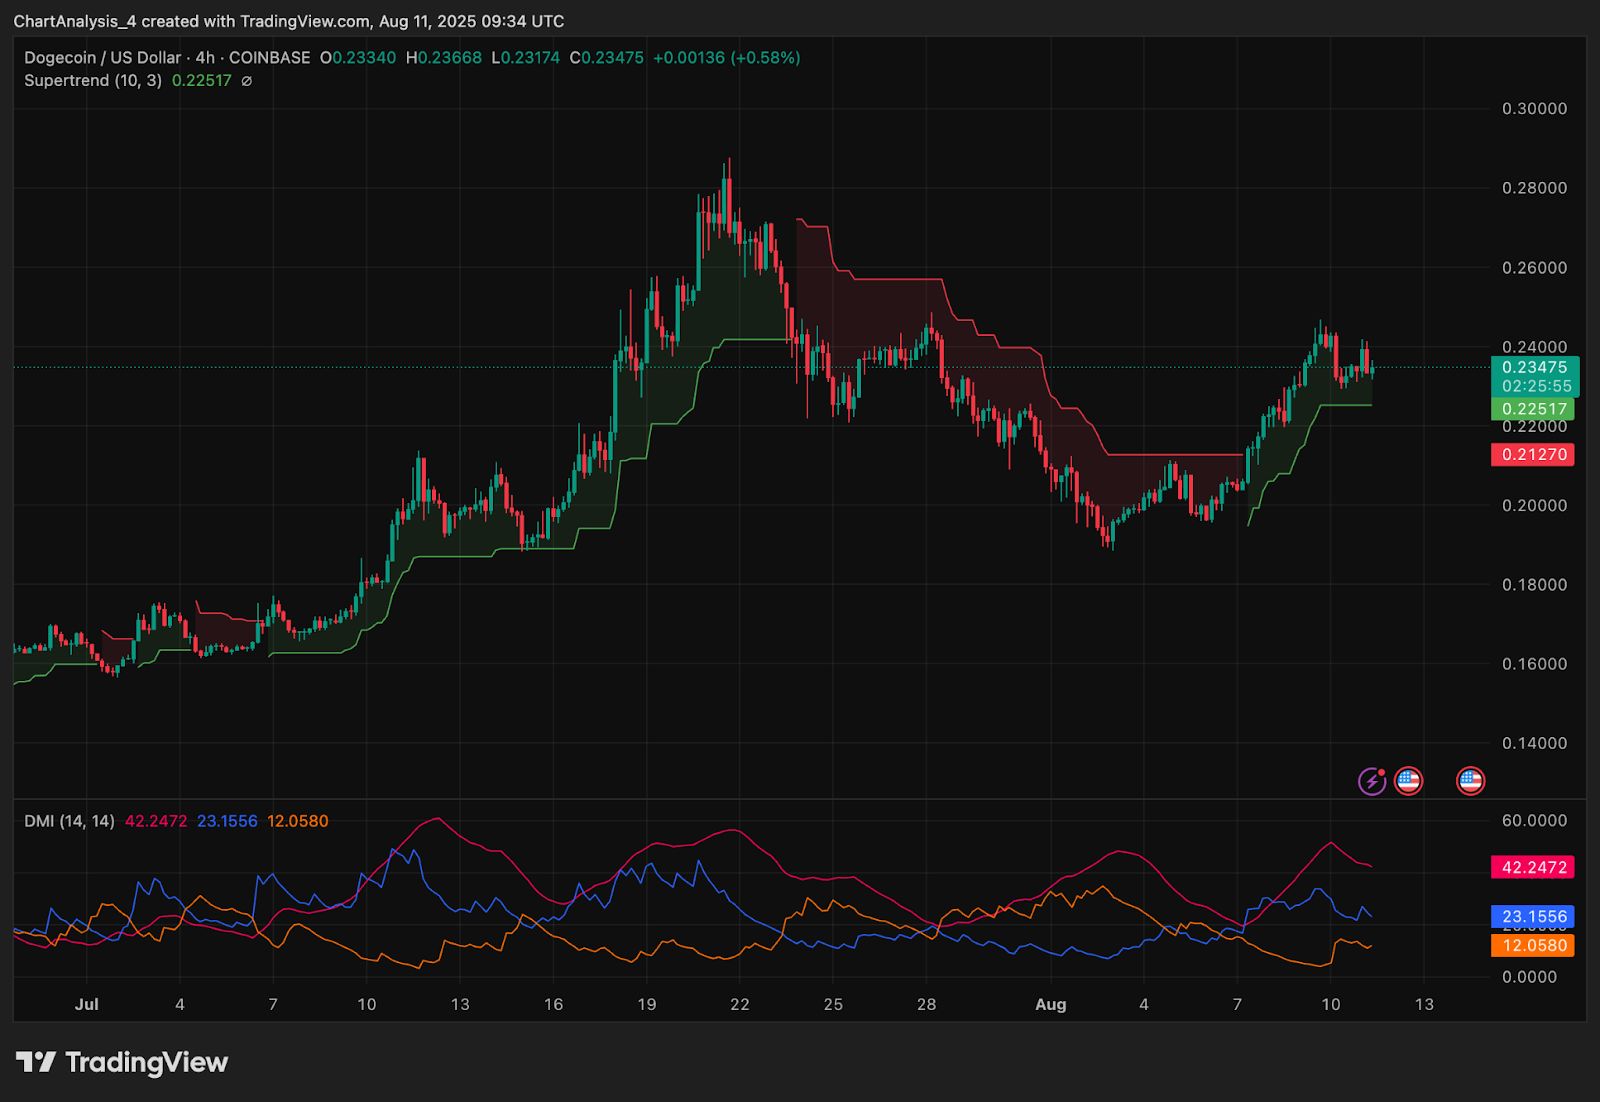
Trend tools still lean bullish. The 4 hour Supertrend stays positive above $0.2252, which makes $0.2233 to $0.2250 a key defense. DMI shows +DI at 23.15 over -DI at 12.05, while ADX at 42.24 signals a sturdy underlying trend.
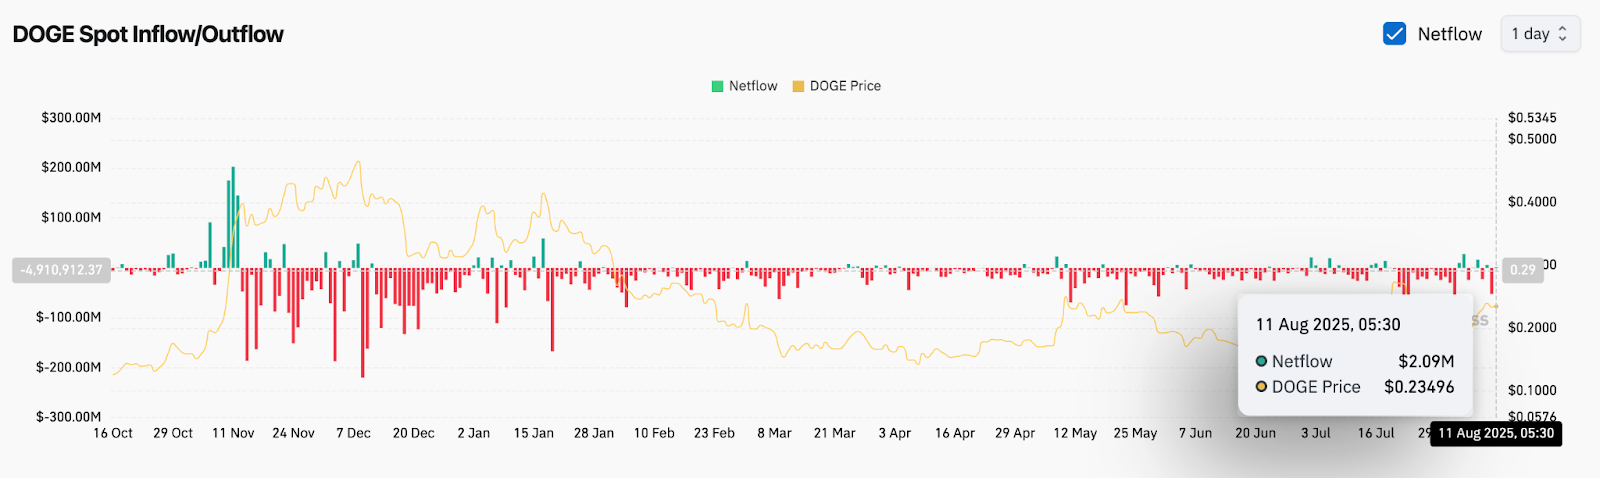
Spot netflow on August 11 printed a modest +$2.09M, which hints at quiet accumulation while price coils.
Dogecoin Price Prediction: Short-term Outlook (24h)
If a 4 hour close lands above $0.2397, the intraday triangle breaks to the topside. That path targets $0.2455 first, then $0.2668 at the 0.382 marker. If momentum persists, price can probe $0.2865 near the 0.5 level, which would also serve as firm confirmation of a larger breakout. This view is invalidated on a close below $0.2233 because that would take out the 50 period average and weaken structure.
If buyers lose $0.2233, the focus shifts back to $0.2150, where the 0.236 mark and the most recent swing lows meet. If there is a breach, it could lead to $0.20 and, if there is pressure, the $0.16 to $0.15 demand block.
Confidence: Between Medium and High. Momentum looks good on all time frames, but it still needs a clean push through $0.2455 to $0.2460 with volume to keep going.
Disclaimer: The content of this article solely reflects the author's opinion and does not represent the platform in any capacity. This article is not intended to serve as a reference for making investment decisions.
You may also like
From Sahara to Tradoor: A Review of Recent “Fancy Drop” Tactics Among Altcoins
The End of Ethereum’s Island: How EIL Reconstructs Fragmented L2s into a “Supercomputer”?
XRP's price beginning to show promise above $2.15: Here’s why