Bitcoin Market Balances Out as Old and Young Coins Hold Steady

Bitcoin (BTC) is once again at a crucial crossroads after dropping below the $120,000 price mark, intensified by strong capital exits. For now, the OG crypto is hovering within the $120K rejection point and other key support regions. With the market currently consolidating, traders are observing these levels as BTC appears to lose steam following multiple rejections at cycle highs.

In brief
- Bitcoin trades sideways as equilibrium emerges between short and long-term holders.
- Market shows no strong speculative pressure, with balanced flows across cohorts.
- Price hovers near $115K as bearish momentum challenges key support zones.
- Consolidation phase hints at base formation before Bitcoin’s next strong move.
Bitcoin Faces Pressure as Short-Term Holders Flinch Amid Range Breakdown
Crypto commentators caution that BTC could continue its downward trend if it breaks below its current range lows. With Bitcoin dropping below $115,000 on Monday, short-term holders (STH) are already feeling the heat of the OG coin’s southbound movement. Oftentimes, such sharp drops have resulted in high price swings, causing nervous sellers to exit the market before a new trend kicks in.
Bitcoin’s HODL Structure, as well as the 30-Day Flows chart, further offers insights into this emerging trend. The data underlines the equilibrium between newly held Bitcoin, often called younger coins or short-term holders, and older coins, mainly referred to as long-term holders (LTH).
In the current market cycle, investors seem to be playing the waiting game, with many actively holding their assets without the intention of rotating.
HODL Structure Signals Neutral Market Regime at All-Time Highs
Crypto expert Axel Adler explained that the Bitcoin HODL Structure and 30-day flows offer clarity regarding the current market atmosphere.
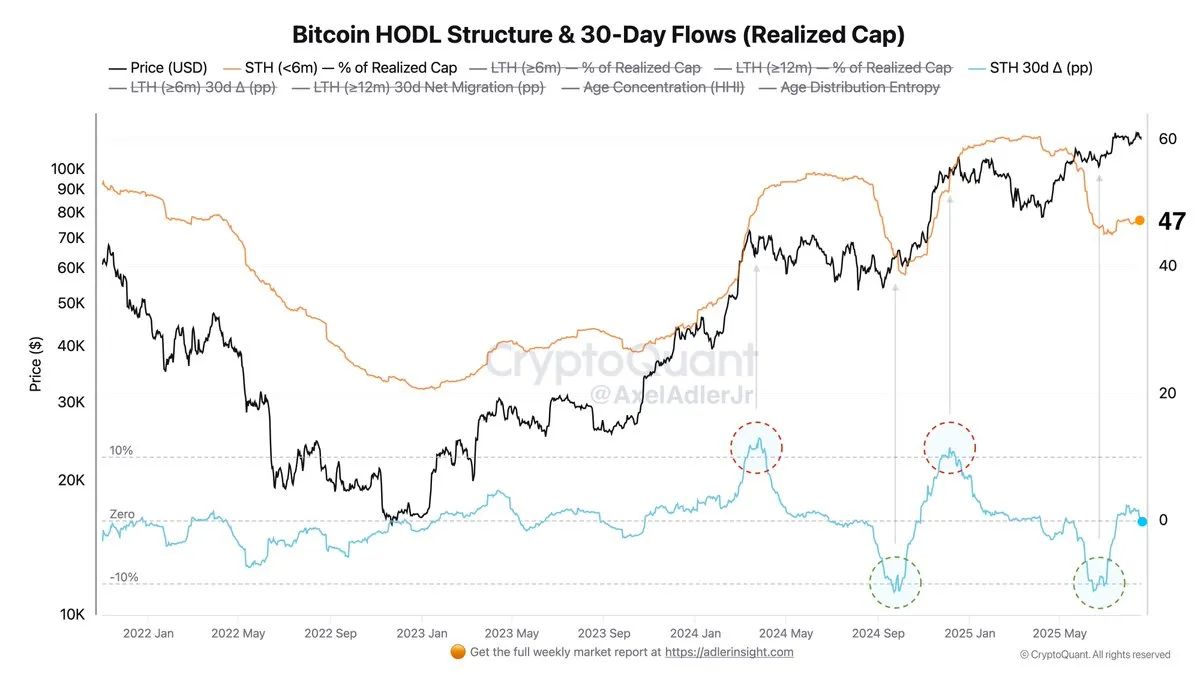
Here are the key data captured by the chart:
- The orange line shows how much of Bitcoin’s value (realized cap) is held by short-term holders (STH, <6 months).
- Meanwhile, the blue line (STH 30d Δ) tracks the 30-day change, showing whether coins are moving from long-term holders (LTH) to short-term holders.
- When the blue line rises, it means coins are moving faster to STH—signaling high turnover and overheated markets.
- On the other hand, a falling blue line indicates that coins are staying put and ageing—showing stronger holders (“diamond hands”) and recovery phases.
As of now, Bitcoin is exchanging hands at all-time highs , with STH share and 30d Δ pegged at 47% and 0, respectively. A zero 30d Δ value indicates that there has been no rotation between young STHs and LTHs over the past month.
Adler clarified that such an occurrence shows a balanced regime, free from speculative buys or long-term pressure. Usually, surges in Δ beyond 10% points (red markers) follow local tops and overheating phases. Meanwhile, breaks below the negative 10 level (green markers) signaled capitulation and recoveries.
Considering the zero Δ at ATH, Adler believes that the most likely outcome for the OG coin is consolidation, alongside a neutral short-term pressure. Such an equilibrium suggests the coin may form a base at high levels before its next strong movement.
Price Action: Near $115K with Bearish Momentum at Key Support
At the time of writing, Bitcoin is trading at $115,186 after moving sideways in the recent intraday session. Insights from TradingView show increased price swings following rejections at $123,463.
For now, the OG coin is hovering close to the lower Bollinger band , and below the 20 SMA at $116,776—indicating short-term bearish momentum and a possibility of entering the oversold zone.
Plus, the Bull Bear Power (BBP) indicator is at -1,943, validating the bearish takeover at this level. Earlier in August, the BBP flashed strong green bars, aligning with the rally to above $122,000. But that momentum has now faded, and the histogram bars have remained mostly red recently, showing continued bearish pressure.
The current base between $114,000 and $118,000 remains a key decision zone that could heavily influence Bitcoin’s next price trajectory. A break below $114,000 could trigger further southbound correction towards previous support levels between $110,000 and $112,000. On the other hand, a move above $118K would signal a fresh upward momentum, potentially driving the BTC price towards the $123,000 rejection mark.
Disclaimer: The content of this article solely reflects the author's opinion and does not represent the platform in any capacity. This article is not intended to serve as a reference for making investment decisions.
You may also like
How much is ETH really worth? Hashed provides 10 different valuation methods in one go
After taking a weighted average, the fair price of ETH exceeds $4,700.

Dragonfly partner: Crypto has fallen into financial cynicism, and those valuing public blockchains with PE ratios have already lost
People tend to overestimate what can happen in two years, but underestimate what can happen in ten years.

Balancer Rallies to Recover and Redistribute Stolen Funds After Major Cyber Attack
In Brief Balancer plans to redistribute $8 million to users after a massive cyber theft. The recovery involved crucial roles by white-hat researchers rewarded with 10% incentives. Unclaimed funds will undergo governance voting after 180 days.

Bitcoin Faces Renewed Selling Pressure as Whale Deposits Spike and Market Fear Deepens