
HBAR Price Finds One Bullish Anchor as Buyers Move Away – What To Expect Next?

HBAR price is still showing signs of weakness on longer timeframes, but one short-term bullish signal on the RSI chart has emerged. Outflows are slowing, price action is stuck in a tight zone, and the market now waits to see if this lone signal can offer a temporary push.
HBAR’s price has struggled to maintain a steady uptrend over the past month. After a 10.7% decline over 30 days, the token has managed a mild 1.24% gain in the past 24 hours.
While its 3-month chart still shows a 16.4% increase, the recent action signals growing reliance on shorter-term spikes rather than sustained rallies. Despite the broader weakness, one bullish pattern has emerged. The 4-hour RSI is starting to tell a different story — but whether it’s enough to hold the price up remains to be seen.
RSI Flashes Divergence But Buyers Retreat
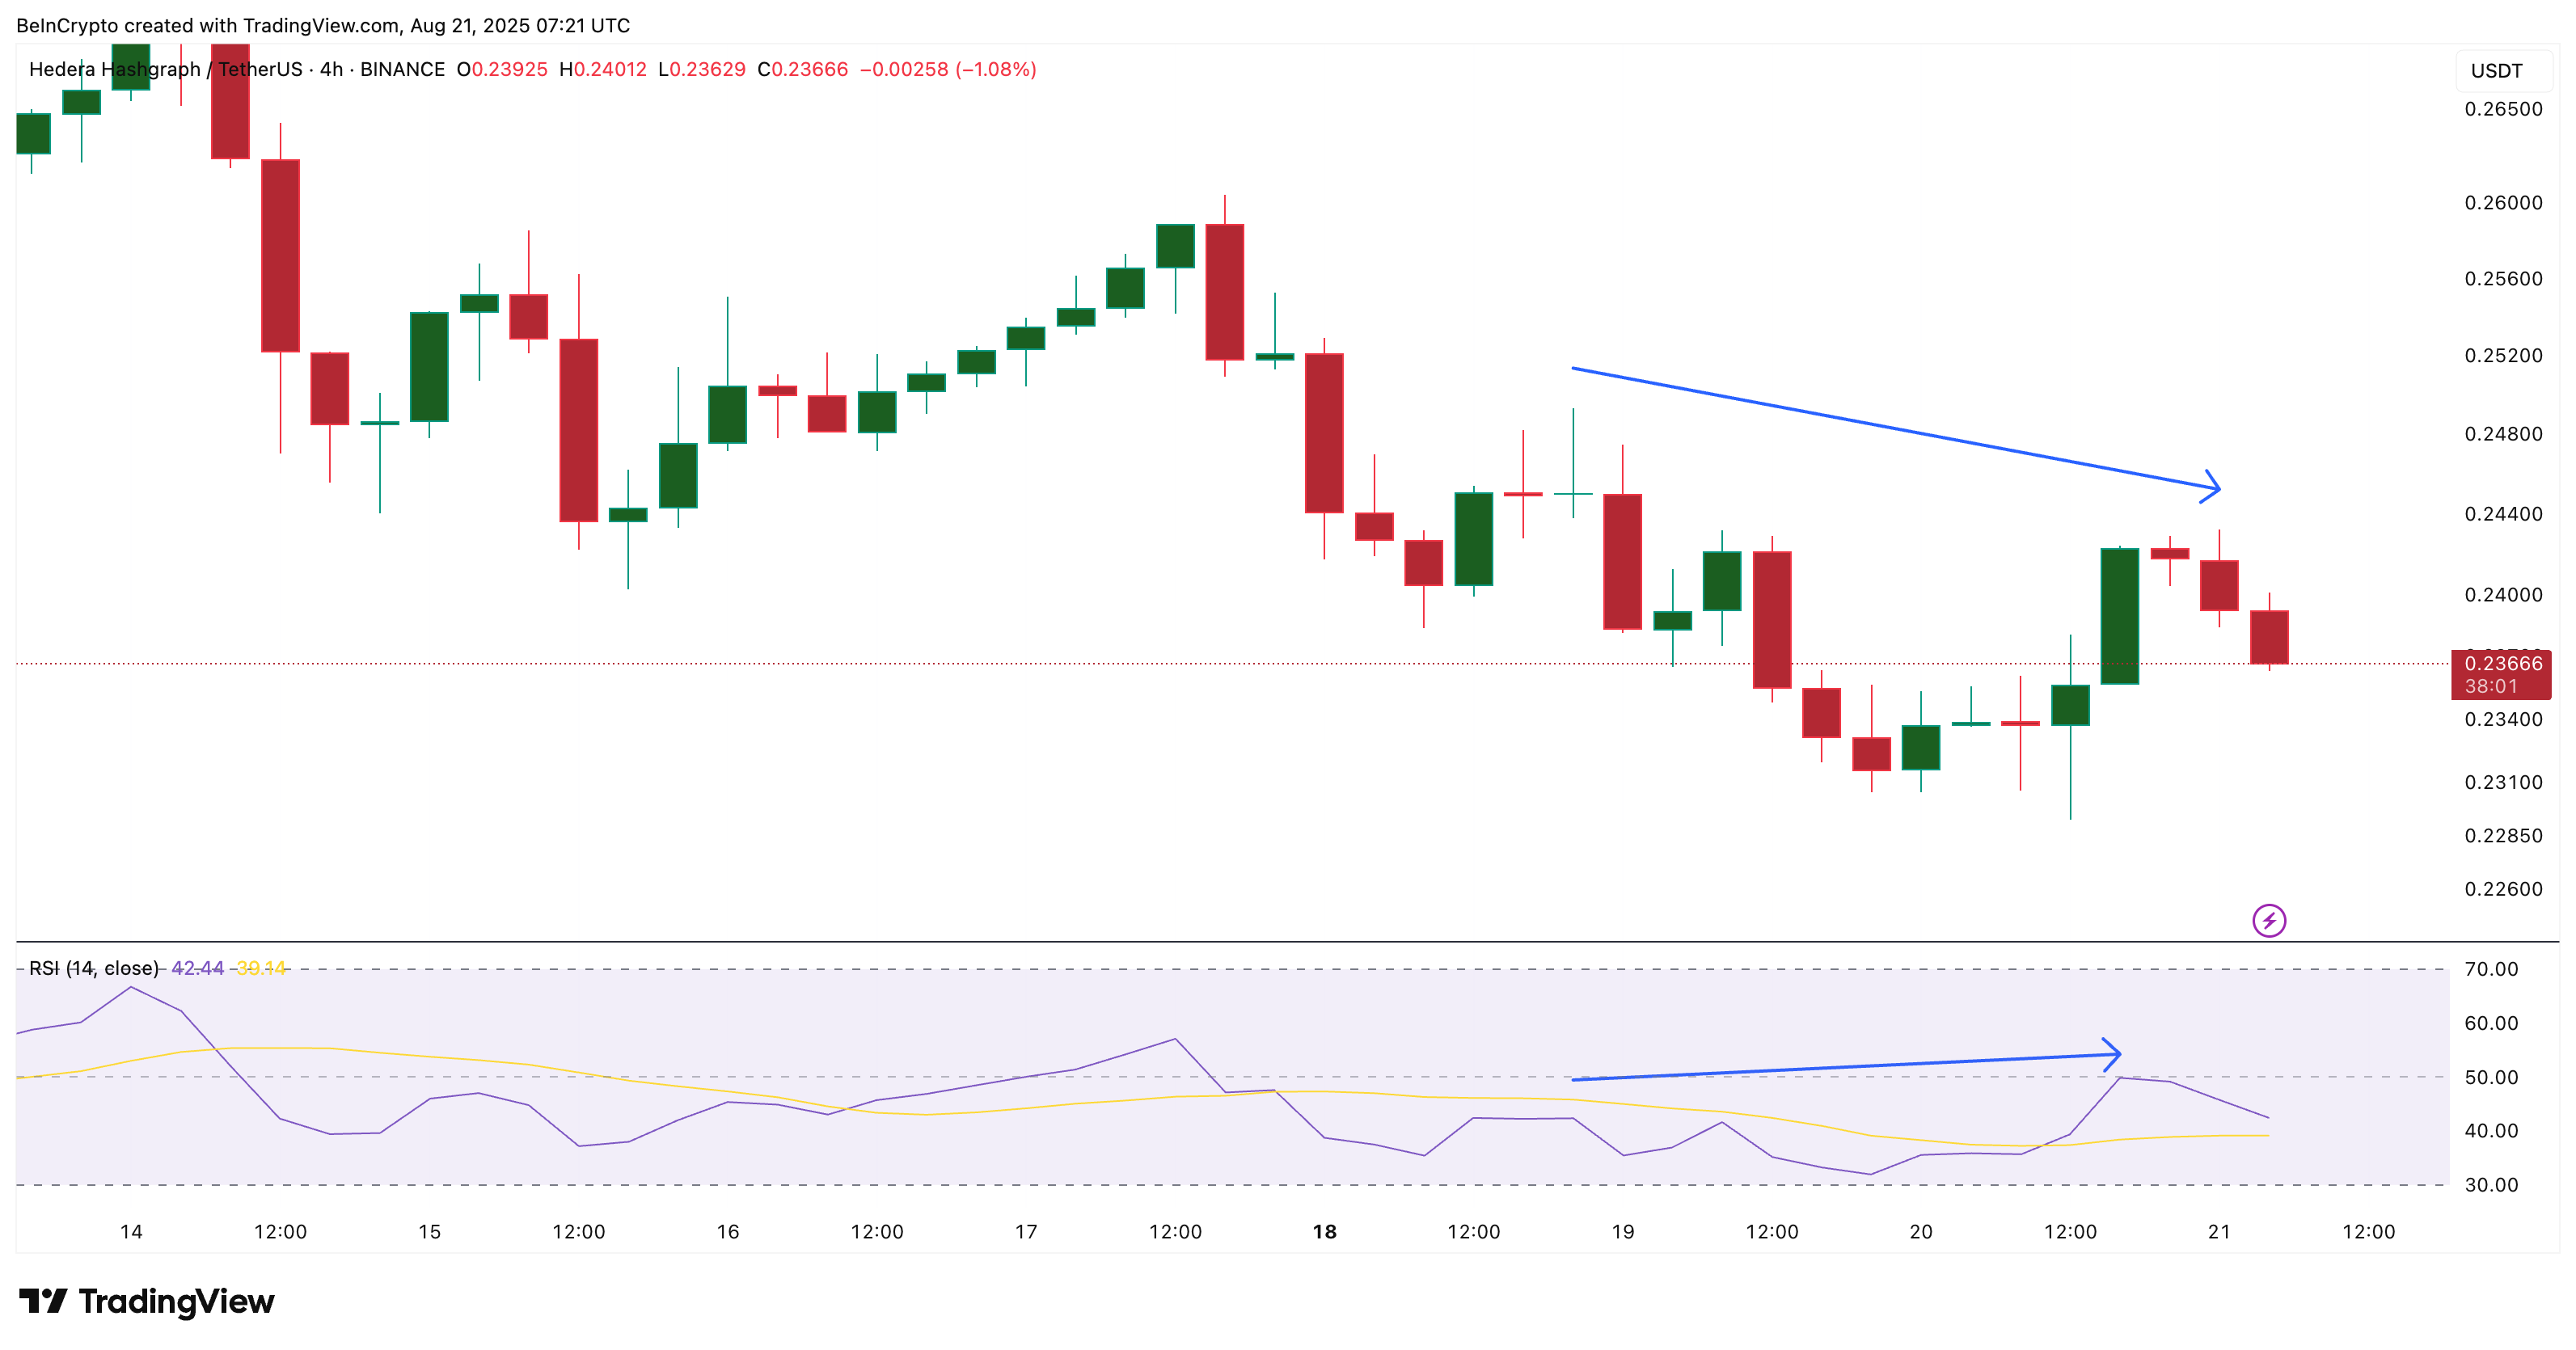
The Relative Strength Index (RSI) is a momentum tool that shows whether buyers or sellers have more control. The Relative Strength Index (RSI) on HBAR’s 4-hour chart shows a subtle bullish divergence.
 HBAR price and bullish divergence:
HBAR price
HBAR price and bullish divergence:
HBAR price
Between August 18 and August 20, the HBAR price formed a lower high, but the RSI climbed higher during the same period. This divergence usually hints that buying momentum is attempting to return — at least in the short term — even as the price struggles to break resistance.
 HBAR sellers are gaining control:
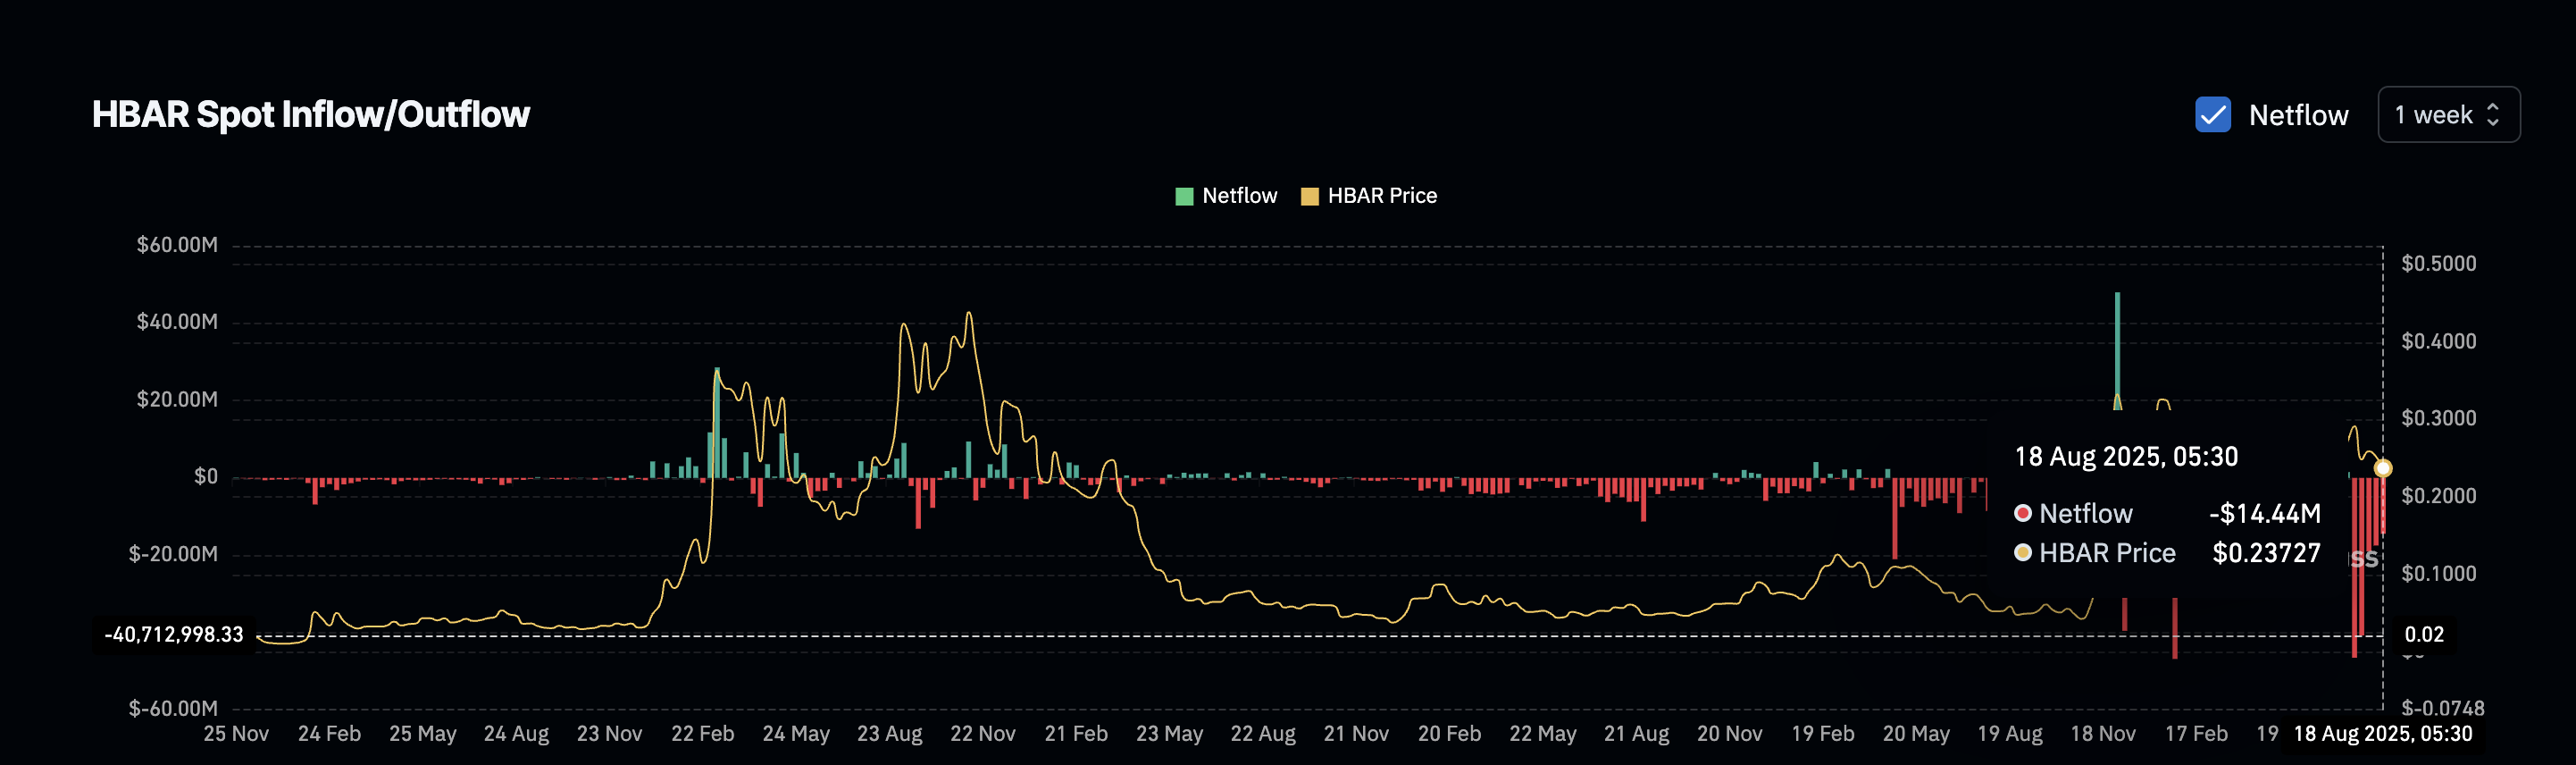
Coinglass
HBAR sellers are gaining control:
Coinglass
However, this short-term momentum contrasts with a broader sign of weakness: outflows are slowing. Over the past month, HBAR’s weekly net outflows, which reflect the volume of tokens leaving exchanges, have been falling steadily.
For token TA and market updates: Want more token insights like this? Sign up for Editor Harsh Notariya’s Daily Crypto Newsletter here.
Fewer tokens leaving exchanges suggests that fewer buyers are withdrawing to hold, a typical sign of reduced confidence. The slowing outflows confirm that buyers are still around — but they’re retreating.
So while HBAR RSI hints at a small recovery, it’s likely a short-term push, not a full reversal. The divergence may be a lone bullish sign in a space where buyer strength is fading fast.
Price Action Shows HBAR Is Stuck — But Not Hopeless
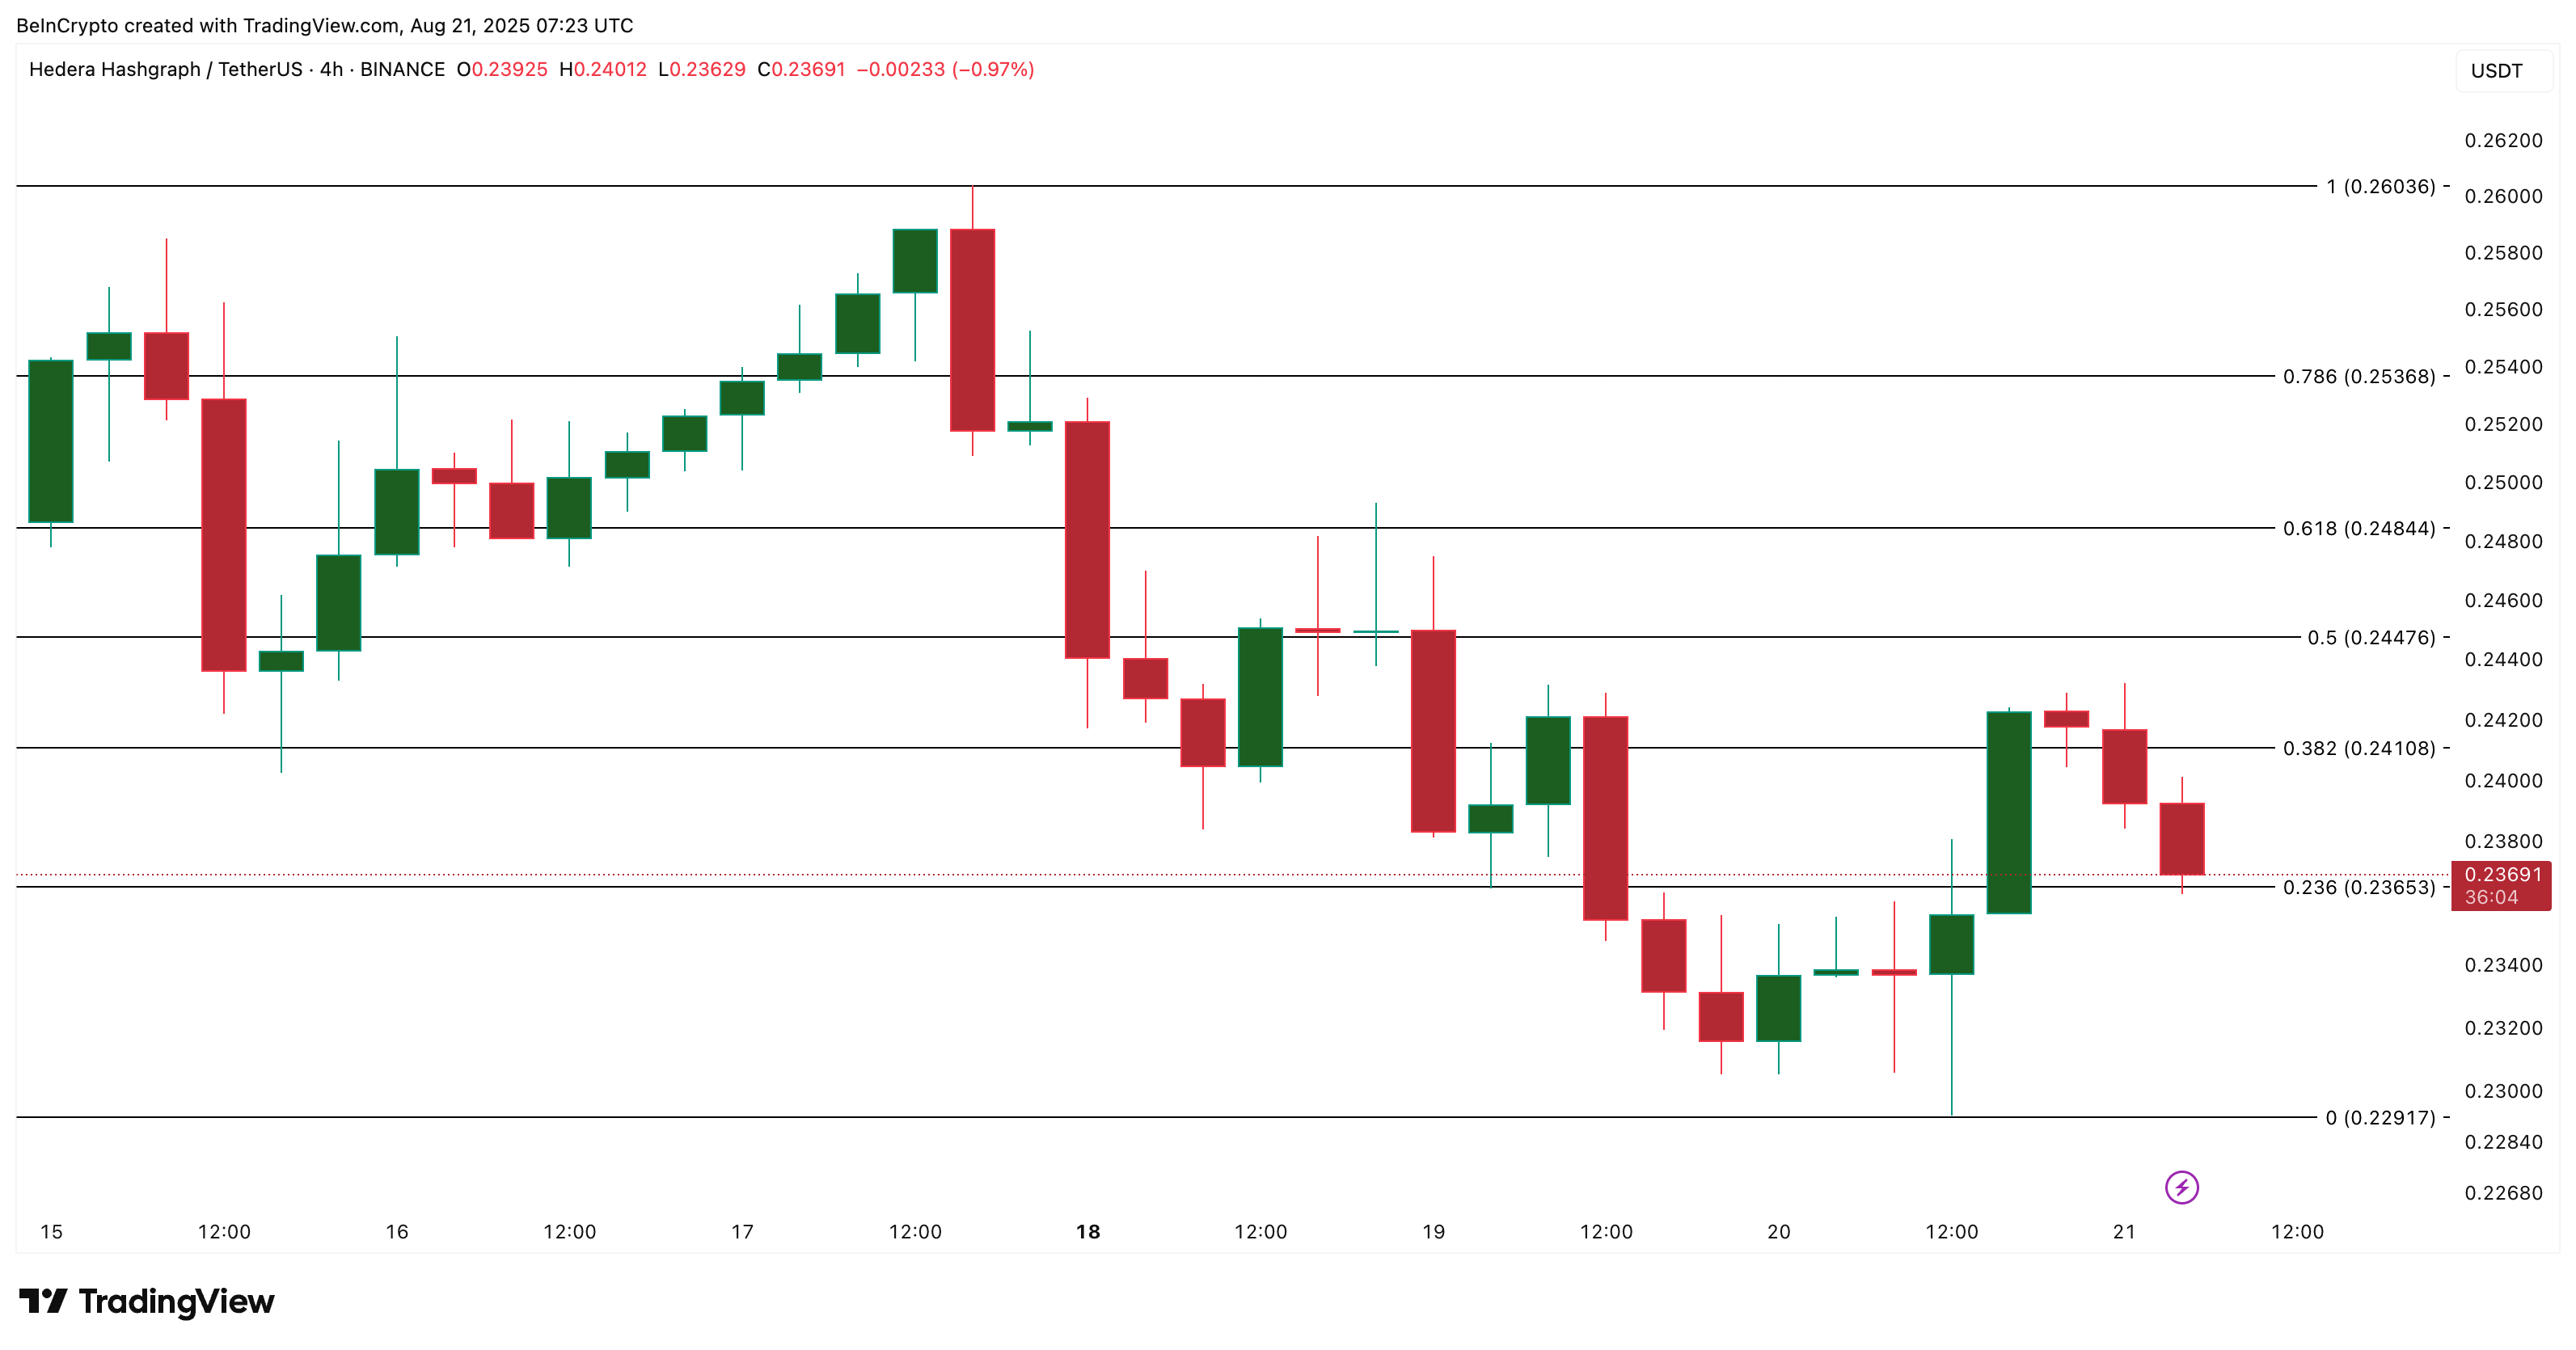
On the 4-hour timeframe, the HBAR price is hovering near a tight range between $0.236 and $0.241. The token has struggled to hold above this zone.
 HBAR price analysis:
TradingView
HBAR price analysis:
TradingView
If HBAR manages a clear candle close above $0.244, a short spike toward $0.253 or even $0.260 could be triggered, given the lack of strong resistance between those levels. But if it fails to hold on to the $0.236 level, the short-term bullish outlook pattern, and sellers likely regain complete control.
This RSI-backed setup is the only current bullish hope on the shorter timeframe, and even that comes with caution. Longer-term trends remain weak.
Disclaimer: The content of this article solely reflects the author's opinion and does not represent the platform in any capacity. This article is not intended to serve as a reference for making investment decisions.
You may also like
Do Kwon Wants Lighter Sentence After Admitting Guilt

Bitwise Expert Sees Best Risk-Reward Since COVID
Stellar (XLM) Price Prediction: Can Bulls Push Toward $0.30 in December?
21Shares XRP ETF Set to Launch on 1 December as ETF Demand Surges