Date: Sat, Aug 23, 2025 | 07:04 PM GMT
The cryptocurrency market turned bullish after Jerome Powell hinted at potential rate cuts in September during today’s Jackson Hole event. Following the remarks, Ethereum (ETH) surged to a new all-time high of $4,878, igniting strong momentum across the altcoin sector, including Artificial Superintelligence Alliance (FET).
FET is trading in the red, bit its latest chart structure suggests that the upside move could be on the horizon.
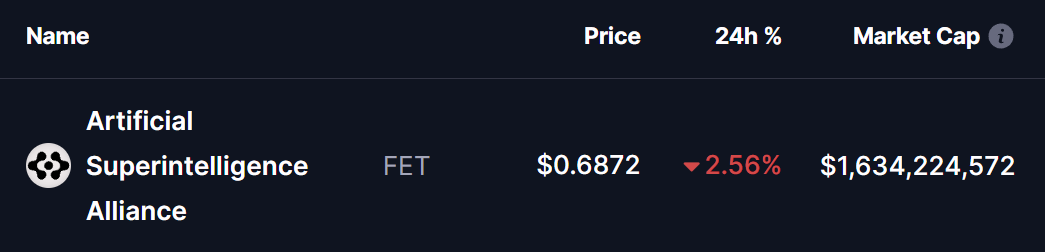 Source: Coinmarketcap
Harmonic Pattern Hints at Bullish Continuation
On the daily chart, FET is forming a Bearish Gartley harmonic pattern. Despite the “bearish” label, this formation often precedes strong rallies during the CD leg — typically the most impulsive stage of the move.
- The structure began at point X ($0.8853),
- Dropped to point A, before rebounding to point B,
- Then retraced lower to point C around $0.6382.
From there, FET has bounced back sharply and is now trading near $0.68, reclaiming the 200-day moving average ($0.6747)—a crucial sign of regained bullish momentum.
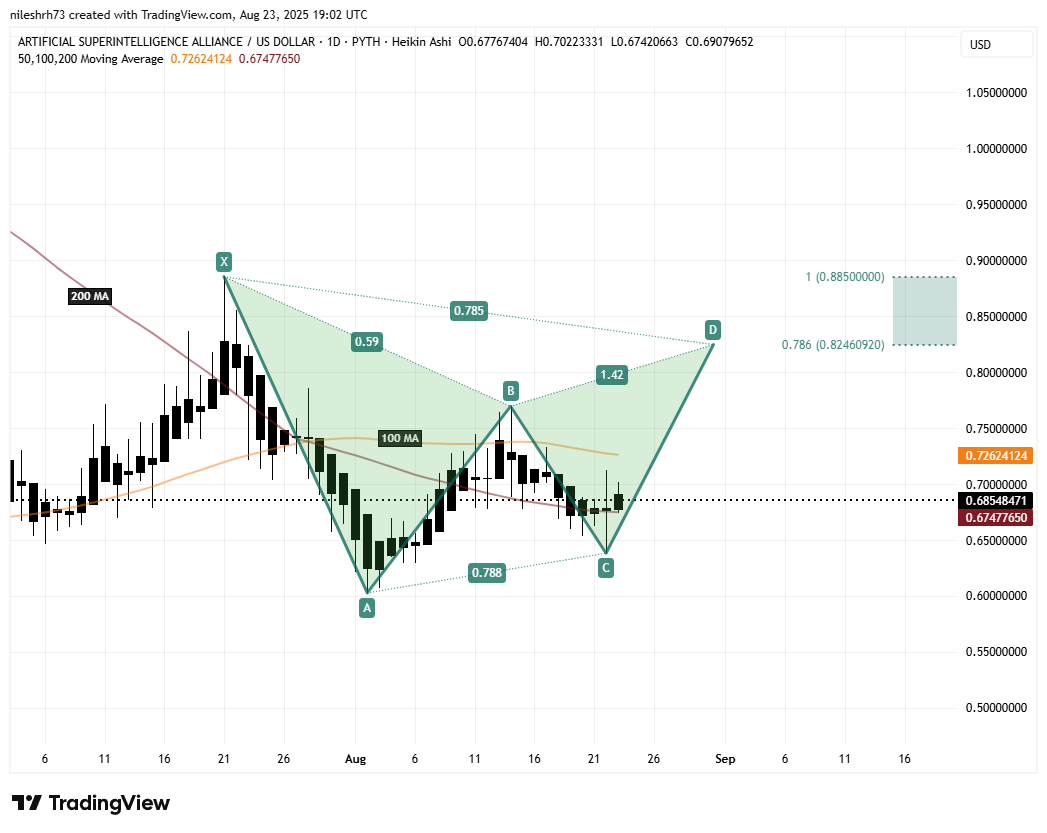 FET Daily Chart /Coinsprobe (Source: Tradingview)
The immediate challenge for bulls lies at the 100-day moving average ($0.7262), which has acted as a strong resistance barrier in recent months. A decisive close above this level could open the doors for the next leg higher.
What’s Next for FET?
If buyers manage to push FET above the 100-day MA, the token could rally toward its Potential Reversal Zone (PRZ) between $0.8246 and $0.8850. These Fibonacci-based targets represent where the Gartley pattern is likely to complete before a potential pullback. From current levels, this move would represent up to a 29% upside.
On the flip side, the 200-day MA ($0.6747) now acts as the most important support. As long as FET holds above this level, the bullish outlook remains valid. A breakdown below it, however, would weaken the setup and delay the upside scenario.