HBAR Price Leans Bullish Despite 3% Dip, Yet A Key Level Could Flip the Trend

HBAR slipped 3% but still held key support. Social attention cooled, open interest grew, and money flow showed buyers active at the dip.
HBAR price slipped more than 3% in the past 24 hours, dropping to $0.239. The weekly chart has now turned nearly 2% red, erasing most of the recent upside. Still, yearly gains remain above 300%, proving the broader trend is not yet broken.
The catch is that the bullish structure is hanging by a thread, and one breach could change it all.
Social Attention Drops Sharply
One reason for caution comes from HBAR’s fading visibility in the market. Since mid-July, HBAR’s social dominance has fallen nearly 90%, dropping from a high of 2.41% on July 13 to 0.93% now. That is a steep decline in chatter and attention.
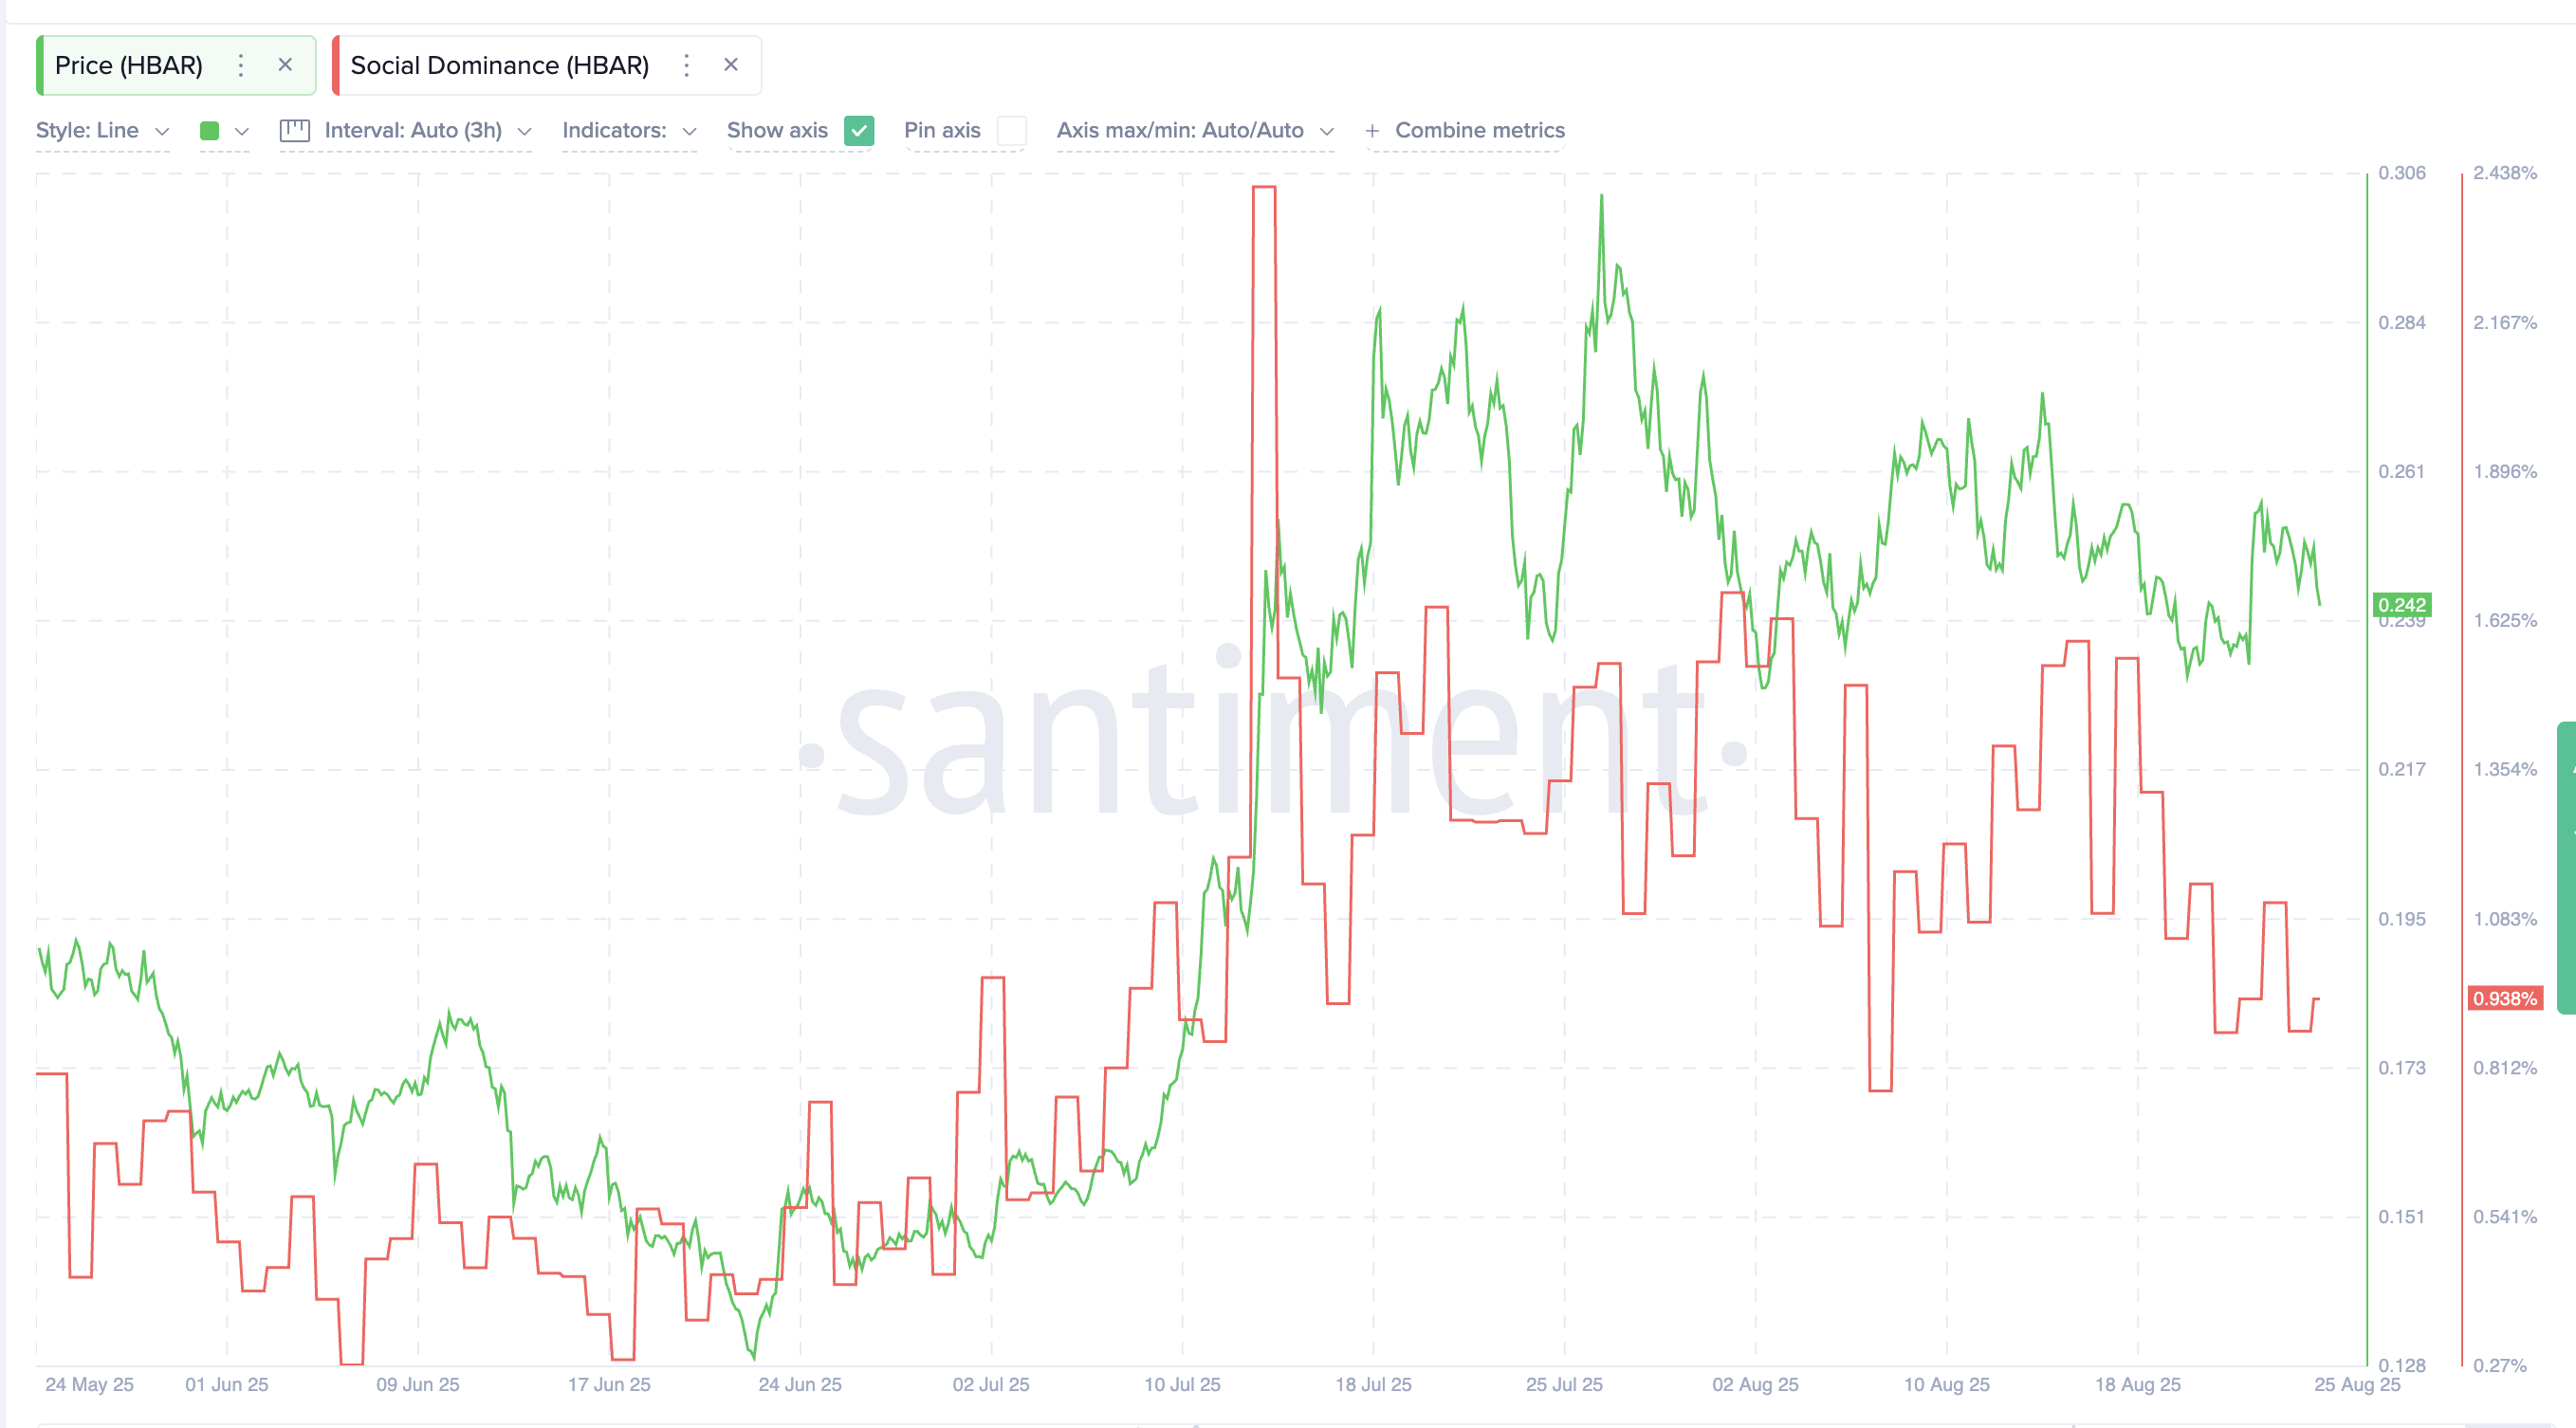 HBAR Price And Social Dominance:
History shows that this matters. In June, a similar lower-low pattern in social dominance aligned with a local price bottom near $0.129, preceding a strong rally. The current drop may suggest a repeat — either the HBAR price finds a new base soon, or traders lose interest further and the price weakens.
Social dominance tracks how much of the overall crypto chatter a token captures. A drop usually means traders are talking about it less, which can weaken short-term hype.
Want more token insights like this? Sign up for Editor Harsh Notariya’s Daily Crypto Newsletter.
Traders Stay Engaged, But Risks Remain
Despite the fading attention, derivatives traders are still heavily involved. Open interest has climbed from $387 million on August 22 to $421 million by August 24, a 9% jump in just two days.
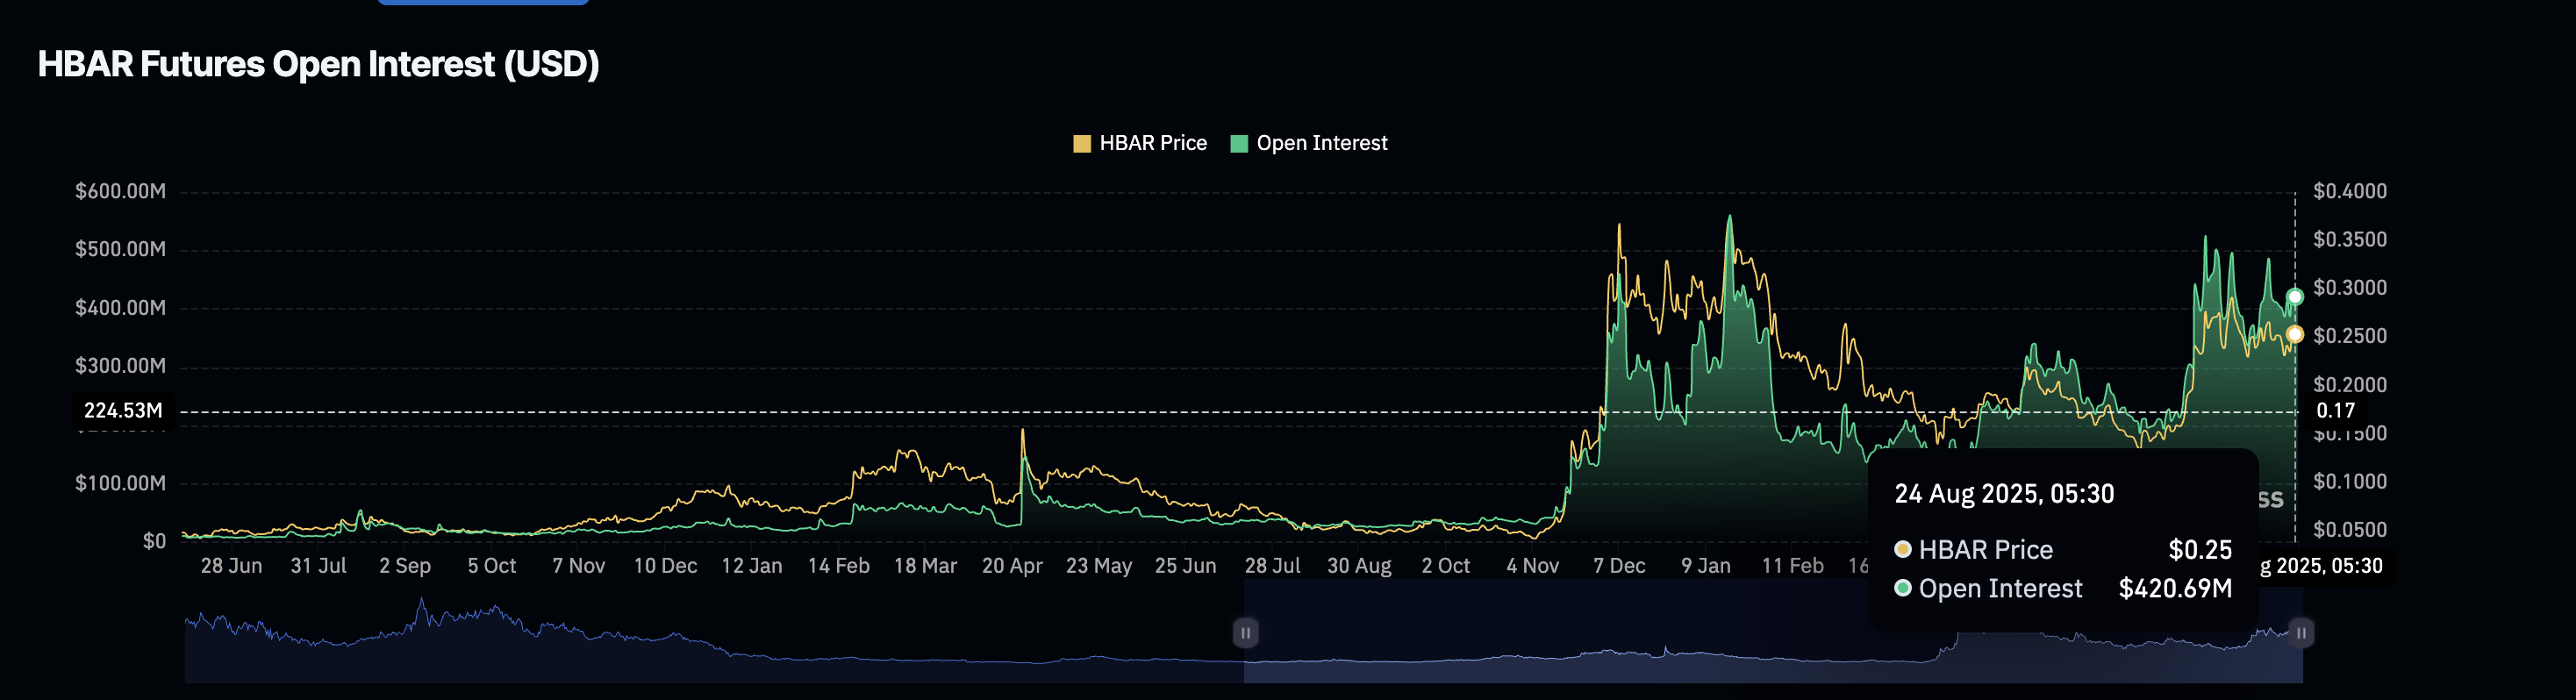 HBAR Open Interest Keeps Surging Despite The Dip:
This mix is a double-edged sword. Rising open interest often signals fresh capital entering the market, which can fuel strong moves.
But it also increases the risk of squeezes. If shorts pile up, a sudden breakout can liquidate them and send the HBAR price higher. On the other hand, if longs dominate and price slips under $0.222, the same leverage could magnify losses.
Open interest shows how much money is tied up in futures contracts for a token. When it rises, more traders are betting on price moves — but that can cut both ways if the market swings.
HBAR Price Levels And Money Flow Hold The Key
Hedera (HBAR) is trading close to immediate support at $0.239. A drop below $0.222 would be dangerous, as there are no strong support zones until $0.188 and then $0.152.
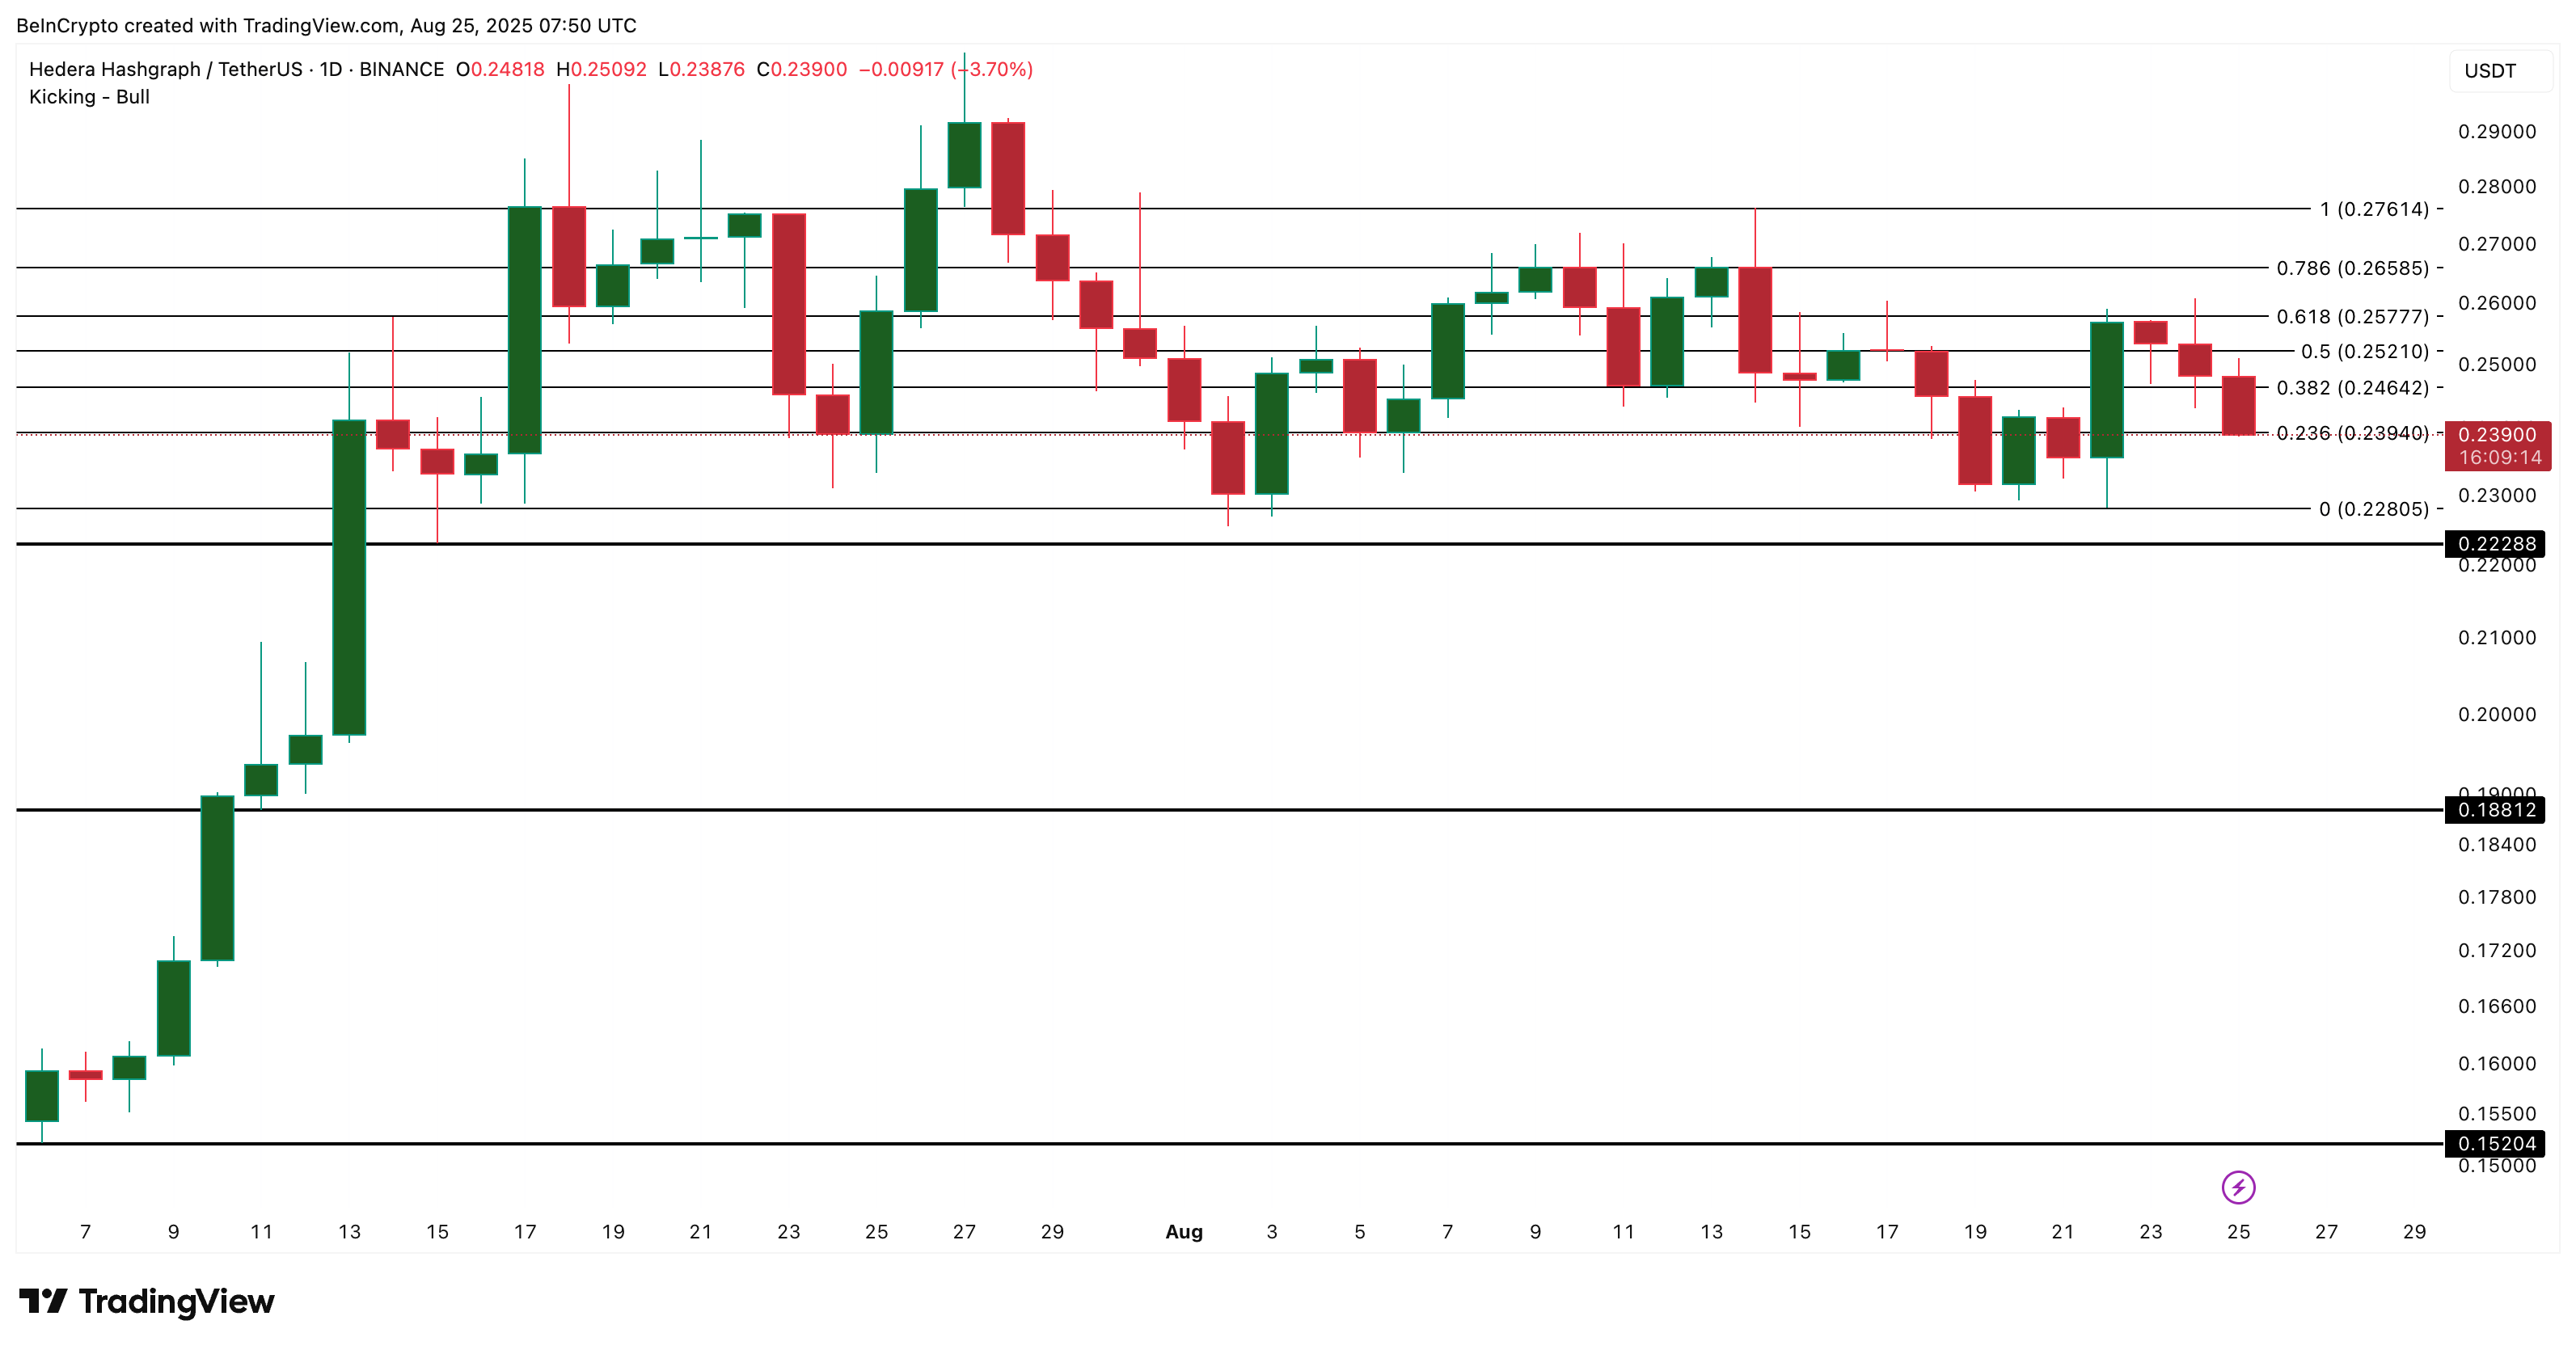 HBAR Price Analysis:
For now, buyers are still active. The Money Flow Index (MFI), which tracks capital entering or exiting an asset, has picked up from 45 to 47.8 while the price eased lower.
In simple terms, more funds flowed in even as the HBAR price dipped — a sign that dip buyers stepped in. This validates the structure as still bullish in the short term, but barely.
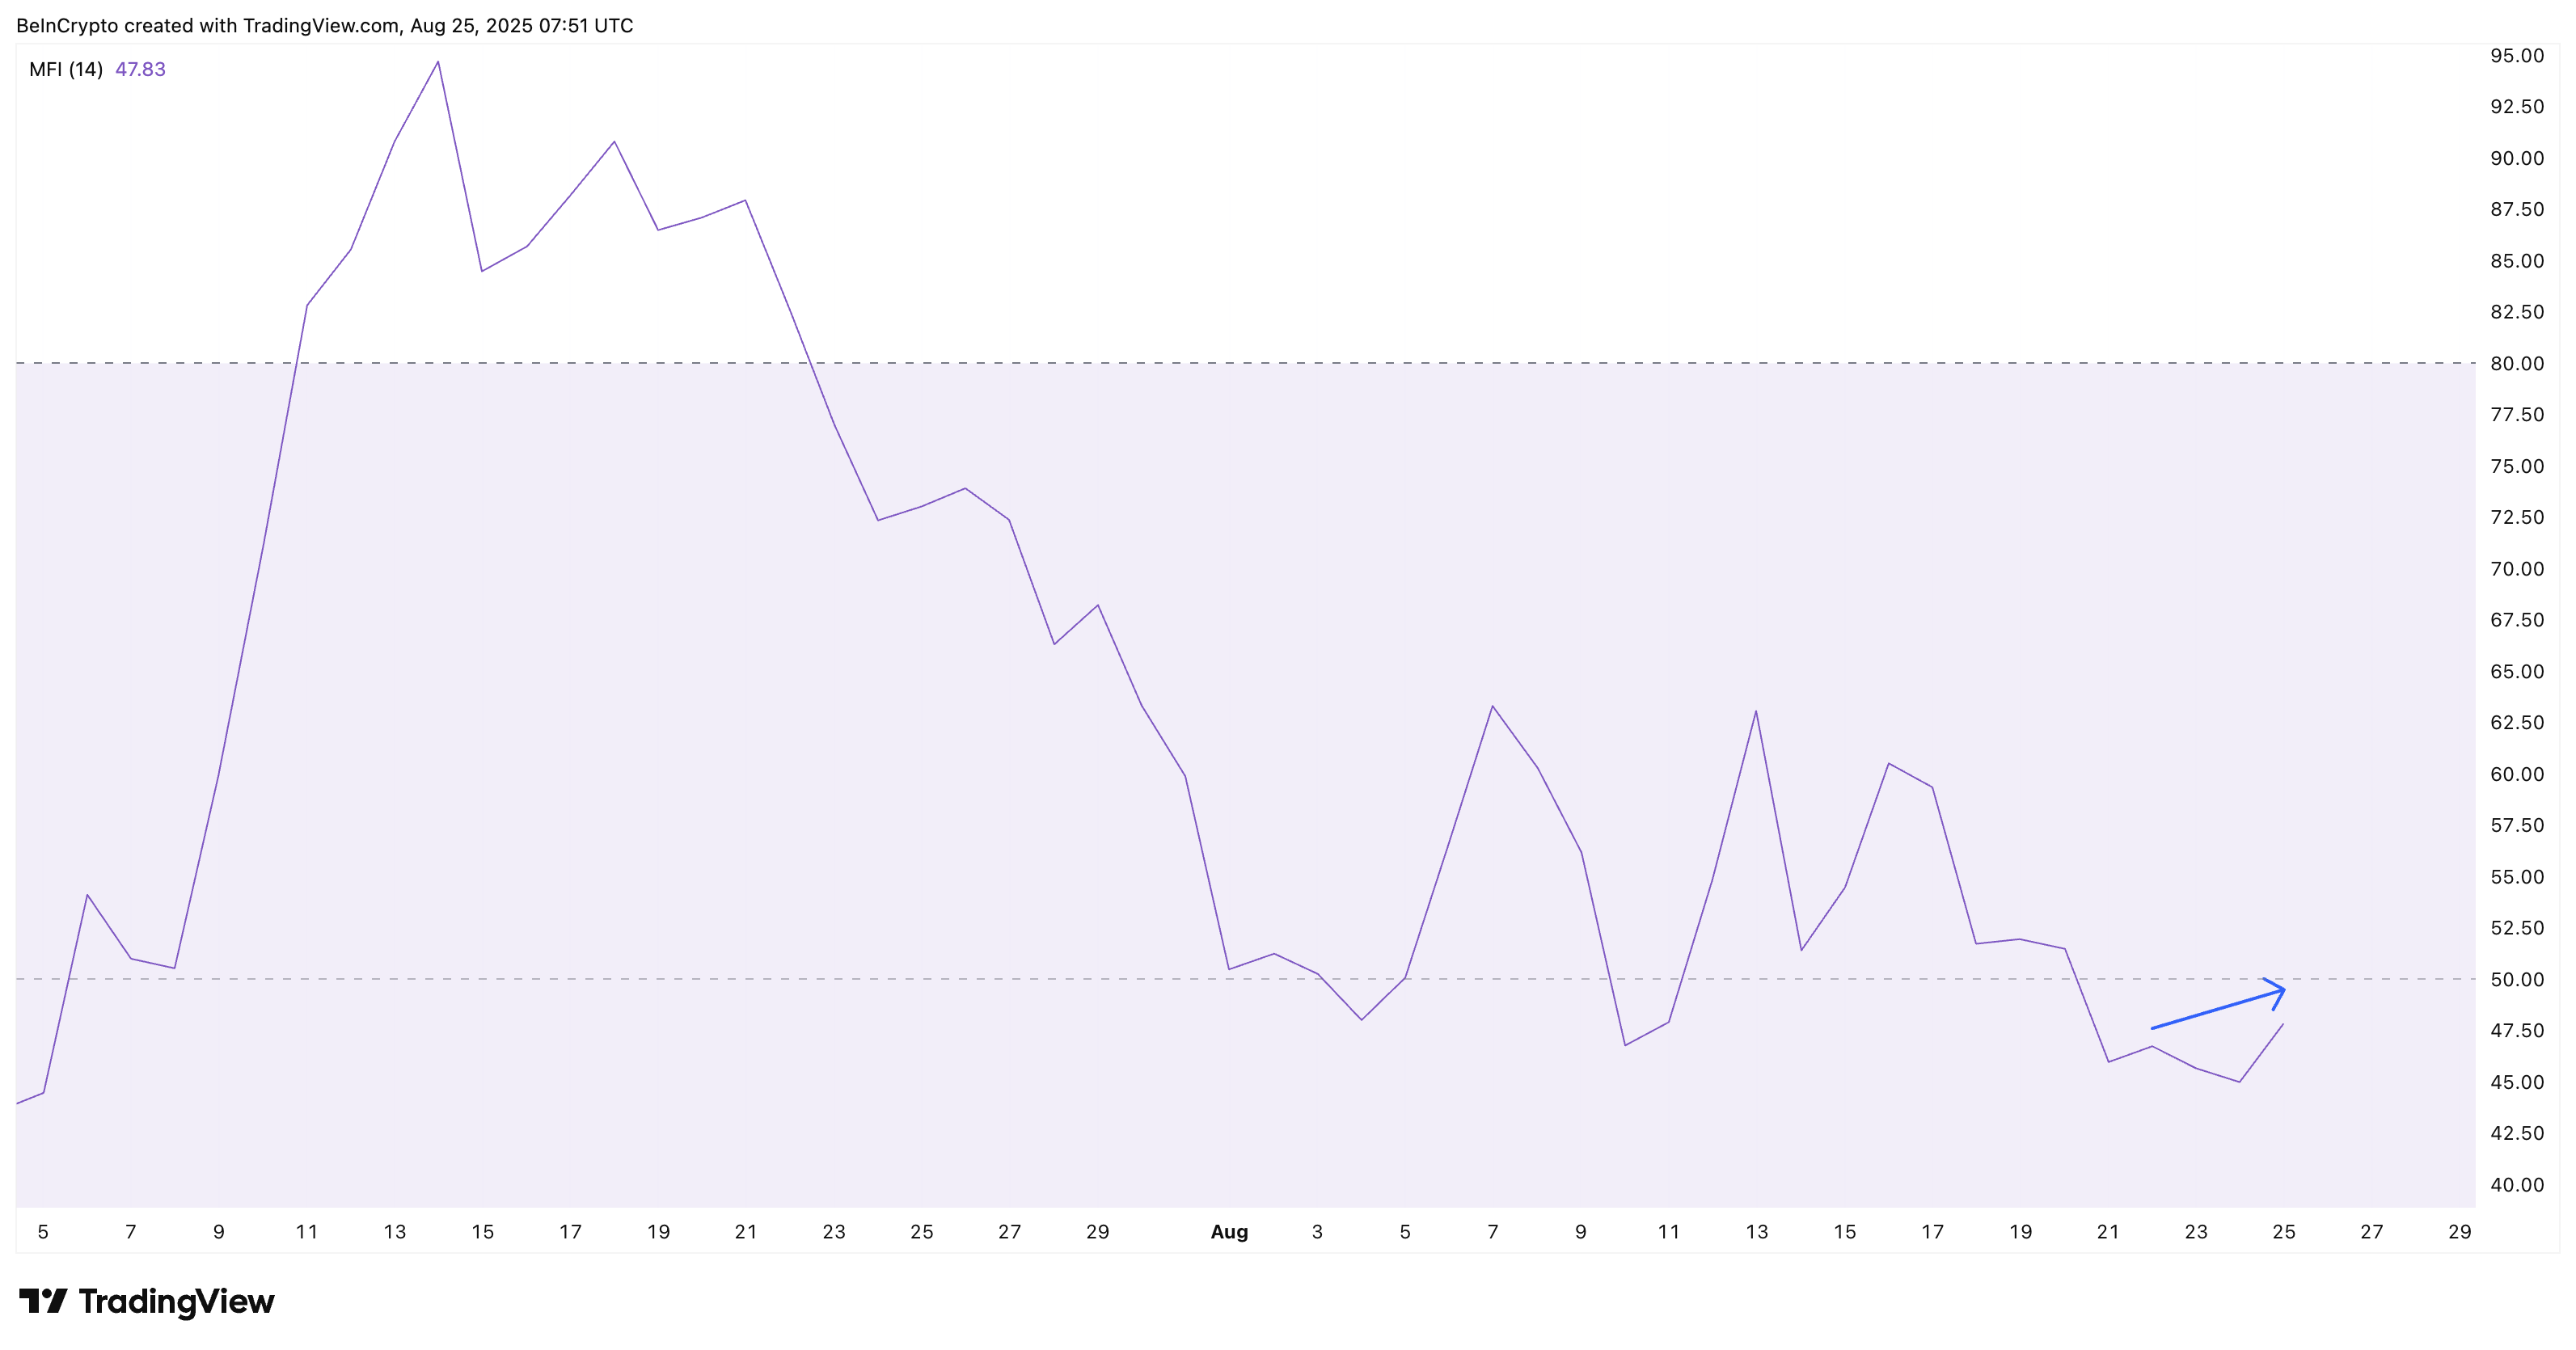 Money Flowing Into HBAR:
On the upside, reclaiming $0.250 and breaking above $0.257 could open the door to $0.276 for HBAR. That level marks the next major resistance. If bulls manage to clear it, higher highs may come back into play, invalidating the bearish vibes.
Disclaimer: The content of this article solely reflects the author's opinion and does not represent the platform in any capacity. This article is not intended to serve as a reference for making investment decisions.
You may also like
With the market continuing to decline, how are the whales, DAT, and ETFs doing?
The New York Times: $28 Billion in "Black Money" in the Cryptocurrency Industry
As Trump actively promotes cryptocurrencies and the crypto industry gradually enters the mainstream, funds from scammers and various criminal groups are continuously flowing into major cryptocurrency exchanges.

What has happened to El Salvador after canceling bitcoin as legal tender?
A deep dive into how El Salvador is moving towards sovereignty and strength.

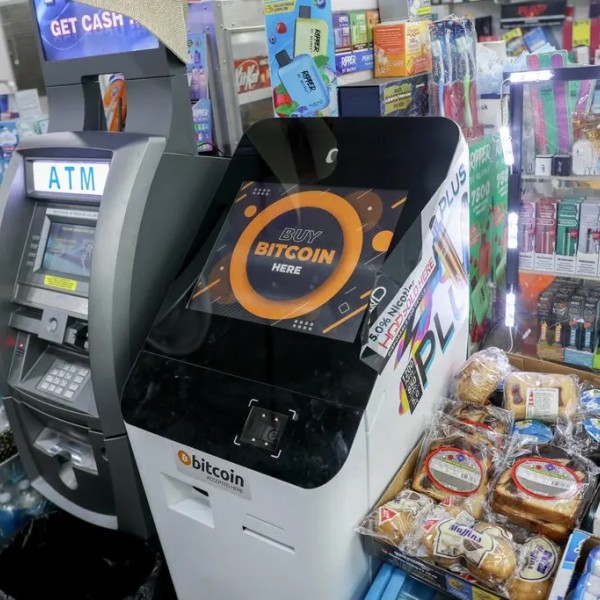
Crypto ATMs become new tools for scams: 28,000 locations across the US, $240 million stolen in six months
In front of cryptocurrency ATMs, elderly people have become precise targets for scammers.