Bitcoin's Taker Buy/Sell Ratio Reaches 7-Year Low: Is a Prolonged Correction Imminent?
- Bitcoin's Taker Buy/Sell Ratio hits 7-year low (0.98), signaling bearish on-chain sentiment amid $110,000 price resilience. - Negative MVRV ratio (-3.37%) indicates widespread underwater holdings, increasing forced selling risks and distribution pressures. - Institutional ETF inflows and macro factors temporarily prop up prices, but structural fragility persists with weak accumulation. - $110,000 support level critical; investors advised to hedge positions and monitor on-chain reversals for bull trend re
Bitcoin's Taker Buy/Sell Ratio, a critical on-chain metric for gauging market sentiment, has plunged to its lowest level in seven years, sparking renewed debates about the sustainability of Bitcoin's recent price resilience. As of August 2025, the 30-day moving average of the ratio has fallen below 0.98—a threshold historically associated with bearish market conditions. This development, coupled with a deteriorating MVRV (Market Value to Realized Value) ratio and declining network activity, raises urgent questions about the risks of a distribution-driven pullback and the implications for near-term positioning.
The Divergence Between Price and On-Chain Sentiment
Bitcoin's price has remained stubbornly above $110,000 since early August 2025, a level that once acted as a critical support zone. However, the Taker Buy/Sell Ratio tells a different story. The ratio's decline to levels last seen in May 2018 and November 2021—both precursors to prolonged bear markets—suggests a growing disconnect between price action and underlying demand.
Historically, the Taker Buy/Sell Ratio below 1 indicates that sell-side orders dominate buying activity. In 2018, this metric signaled the onset of a 70% price correction from $19,000 to $3,000. Similarly, in 2021, the ratio's drop below 0.98 preceded a 60% decline from $69,000 to $30,000. Today, the same pattern is emerging, with selling pressure outpacing buyers despite Bitcoin's nominal price strength.
This divergence is particularly concerning because it implies that Bitcoin's price gains are not being driven by robust accumulation. Instead, the market appears to be propped up by institutional inflows into spot ETFs and macroeconomic tailwinds, such as U.S. dollar weakness and Federal Reserve rate cuts. However, these factors may not be enough to offset the structural fragility highlighted by on-chain metrics.
The MVRV Ratio: A Warning of Undervaluation and Distribution
The MVRV ratio, which compares Bitcoin's market value to its realized value (the total value of coins at their last transfer price), has also turned negative at -3.37%. This indicates that the average holder is currently underwater, a condition that historically precedes accumulation phases. However, the negative MVRV ratio also signals that a significant portion of the market is in a bearish position, increasing the likelihood of forced selling from loss-making holders.
Historically, Bitcoin's MVRV ratio has shown a cyclical pattern: it rises sharply during bull phases, peaks near 3.5–4.0 (indicating overheating), and then collapses during corrections. The current reading of -3.37% aligns with the early stages of a bearish distribution phase, where short-term holders (STHs) are more likely to offload positions to mitigate losses.
The combination of a weak Taker Buy/Sell Ratio and a negative MVRV ratio creates a high-risk environment for further price declines. While Bitcoin's dominance in the crypto market remains strong at 86.3%, the broader ecosystem is showing signs of fragility. Altcoin activity has stagnated, and derivatives markets have recorded $900 million in liquidations, with 90% of those being long positions.
Implications for Near-Term Positioning and Risk Management
The current market dynamics demand a cautious approach to positioning. Here are three key considerations for investors:
Hedge Against Short-Term Volatility:
Given the elevated risk of a correction, investors should consider hedging long positions with short-term options or inverse ETFs. For example, a 10% allocation to Bitcoin put options with a strike price at $105,000 could limit downside risk if the $110,000 support level fails.Monitor Key Support Levels:
The $110,000–$112,000 range is critical for bulls. A clean break below $110,000 could trigger a test of the mid-$100Ks, while a recovery above $117K–$120K would signal a resumption of the uptrend. Traders should use this range to adjust stop-loss levels and manage position sizes accordingly.Rebalance Exposure to Structural Demand:
While on-chain metrics are bearish, structural demand from institutions remains intact. U.S. spot Bitcoin ETFs hold $65 billion in assets, and inflows into products like BlackRock's IBIT suggest that institutional confidence has not entirely evaporated. Investors should consider rebalancing portfolios to prioritize ETFs and long-term holding strategies over speculative bets on altcoins.
The Path Forward: A Market in Transition
Bitcoin's current situation mirrors the 2018 and 2021 bear market precursors, but it also shares similarities with the early stages of prior bull cycles. The MVRV ratio's negative reading and the Taker Buy/Sell Ratio's historic low suggest that the market is in a transitional phase, where short-term corrections could pave the way for a new accumulation period.
However, the risks of a prolonged correction remain elevated. If selling pressure persists and the Taker Buy/Sell Ratio continues to weaken, Bitcoin could face a deeper pullback toward the $100,000 level. Conversely, a reversal in on-chain sentiment—marked by a sustained increase in the Taker Buy/Sell Ratio and a return of the MVRV ratio to positive territory—could signal the resumption of the bull trend.
Conclusion: Navigating the Crossroads
Bitcoin's Taker Buy/Sell Ratio at a 7-year low and the MVRV ratio's negative reading present a complex market environment. While the price remains above critical support levels, the divergence between price strength and on-chain sentiment underscores the fragility of the current rally. Investors must remain vigilant, balancing caution with an eye for potential opportunities in a market that could either consolidate or enter a new bearish phase.
For now, the $110,000–$112,000 range will be the focal point for determining Bitcoin's near-term direction. Until on-chain metrics show a clear reversal, the prudent approach is to prioritize risk management, hedge against volatility, and position for a potential rebound in the context of a broader bull market.
Disclaimer: The content of this article solely reflects the author's opinion and does not represent the platform in any capacity. This article is not intended to serve as a reference for making investment decisions.
You may also like
Bitcoin Faces Intensifying Sell-Off as ETF Outflows and Leverage Unwinds Pressure Markets
Solana ETF Hit 18-Day Inflow Streak

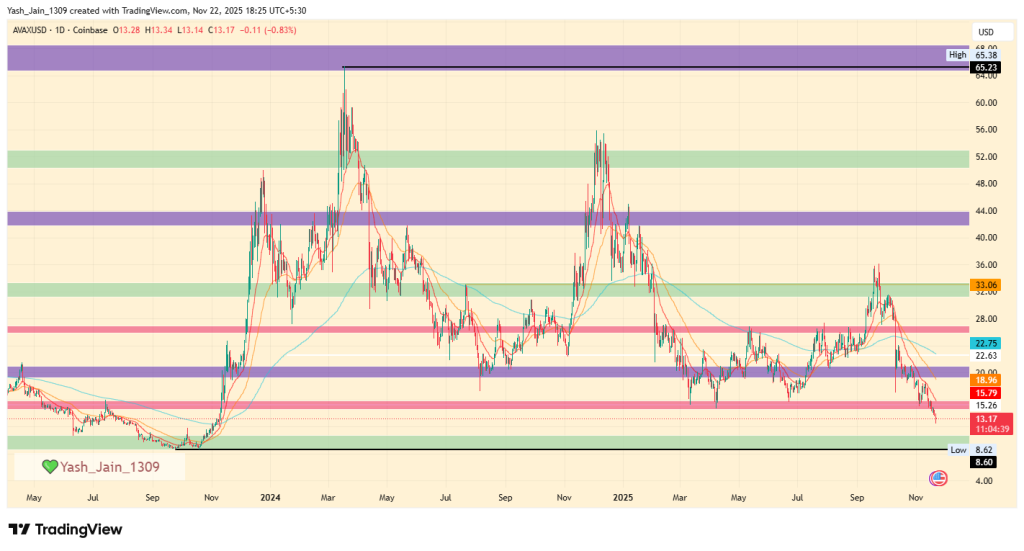
Avalanche Price Prediction 2025, 2026 – 2030: Will AVAX Price Hit $100?
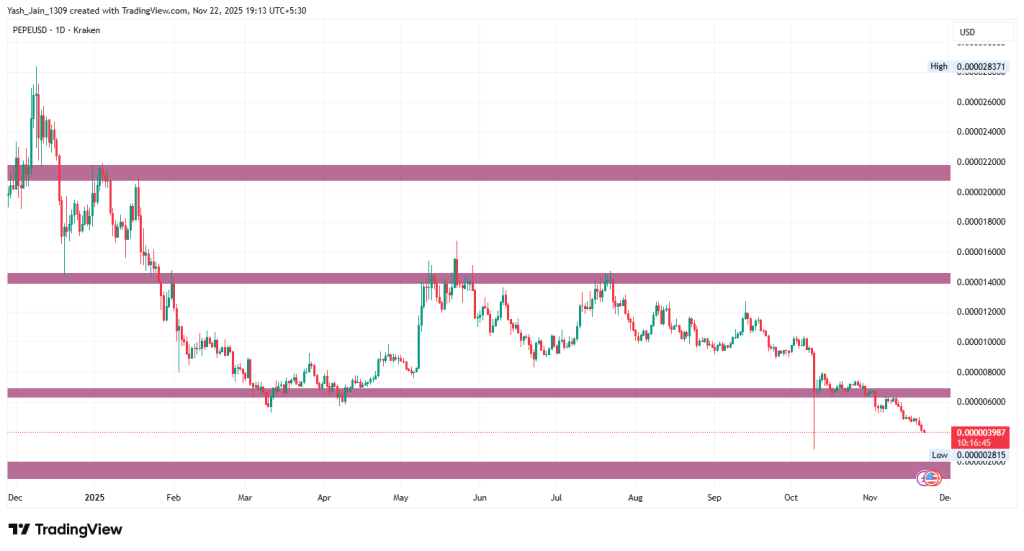
PEPE Price Prediction 2025, 2026 – 2030: Can Pepe Memecoin Reach 1 Cent?