Bitcoin price is testing critical support near $112K after a large whale selloff, falling volume, and bearish EMA/SMA crossovers. Bulls must reclaim the 9-day EMA and break above $116,500 to avoid a sharper breakdown; traders should monitor whale holdings, volume spikes, and EMA/SMA levels for confirmation.
-
Bitcoin clings to $112K–$113K support; repeated retests raise breakdown risk.
-
Bearish momentum: BTC below the 9-day EMA and 50-day SMA, with rejection at $114K–$116.5K.
-
Whale activity and fading volume compound seasonal risk—September historically weak for BTC (Wise Crypto data).
Bitcoin price near $112K faces whale selloffs and weak support; read our live analysis, key EMA/SMA levels, volume data, and trade alerts to prepare for a potential breakdown.
Bitcoin wobbles near $112K as whales dump and bearish signals pile up. September’s history haunts—will BTC crash or hold the line this time?
- Bitcoin clings to the $112K–$113K support zone as repeated retests weaken structure, raising the risk of a sharp breakdown ahead.
- Bearish momentum grows with BTC trading below key moving averages and rejection at $114K–$116.5K resistance intensifying selling pressure.
- Whale activity, fading volume, and September’s historically poor performance are stacking up against the bulls ahead of a volatile month.
Bitcoin is dancing dangerously on thin ice as it retests a weakening support zone. With whale selloffs and September’s curse lurking, BTC traders brace for what could be a brutal breakdown ahead.
What is driving Bitcoin’s drop near $112K?
Bitcoin price is under pressure from a combination of large whale liquidations, falling trading volume, and bearish technical crossovers. These factors have pushed BTC below short- and mid-term moving averages, increasing the likelihood of a decisive move if bulls fail to reclaim critical EMA/SMA levels.
How severe is the short-term technical picture?
BTC/USDT is trading around $111,611, down 2.95% in 24 hours and 3.20% over seven days. The 9-day EMA (~$114,814) sits above current price, and the 50-day SMA (~$116,546) has acted as resistance. A bearish 9-day EMA crossing beneath the 50-day SMA confirms short-term distribution.
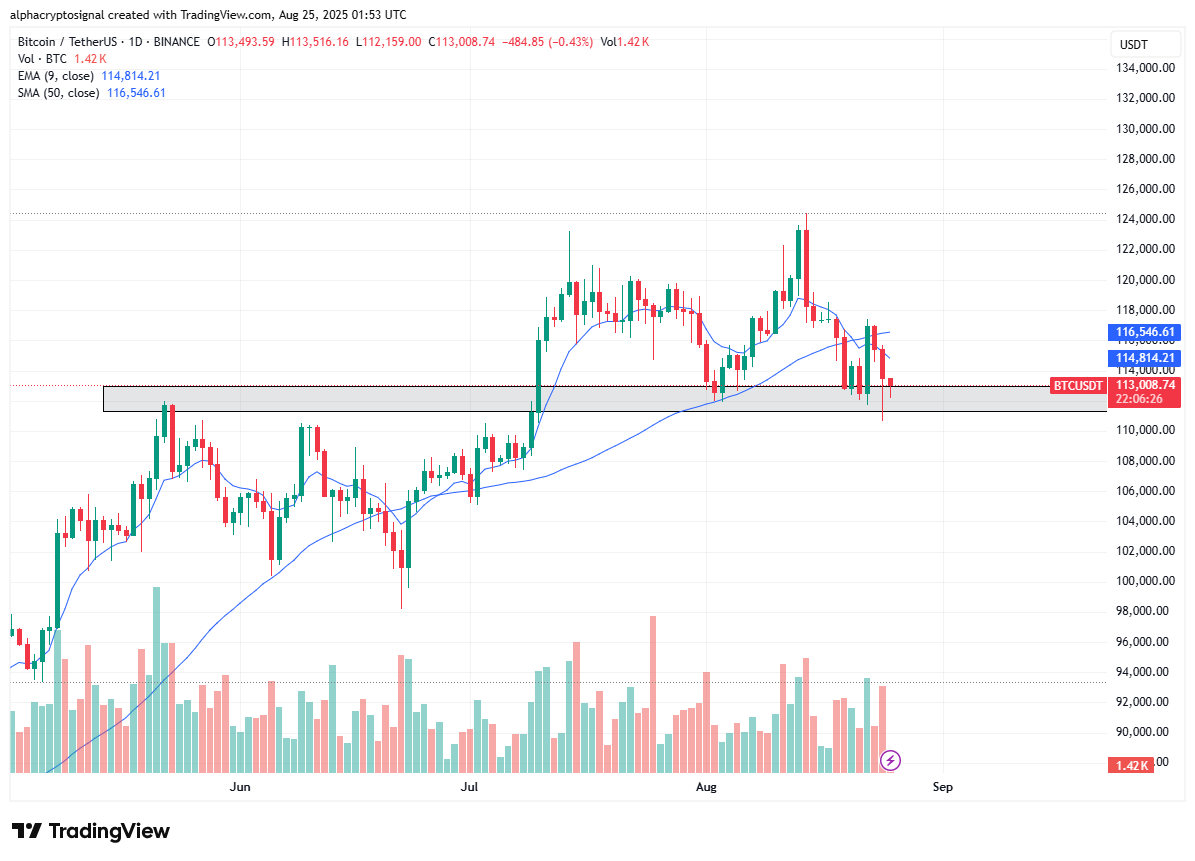
Source: AlphaCryptoSignal Via X
How weak is the $112K support zone?
The $112,000–$113,000 band is critical. On August 25, BTC dipped to $112,159 before a weak bounce, indicating sellers remain active at that level. Volume shows a notable red spike on the latest retest, suggesting diminishing buying conviction.
A dormant whale sold 24,000 BTC recently and still holds above 152,000 BTC. Such concentrated holdings can increase downside pressure if further disposals occur. Wise Crypto data shows September has closed lower nine of the past 13 years, averaging -3.77%—a seasonal headwind.
What must bulls do to flip short-term sentiment?
Bulls need to reclaim the 9-day EMA and push price decisively above $116,500 to signal renewed accumulation. A confirmed break above the 50-day SMA near $116,546 with rising volume would reduce breakdown odds and invite short-covering rallies.
Frequently Asked Questions
Will Bitcoin break below $112K this week?
Short-term risk is elevated given current structure and whale selling, but a breakdown depends on follow-through volume and macro catalysts. Monitor volume and on-chain whale transfers for decisive clues.
How should traders manage risk around these levels?
Use tight position-sizing, set stop-losses below confirmed support, and consider scaling exposure if price reclaims the 9-day EMA with increased buying volume.
Key Takeaways
- Support at $112K–$113K: Repeated retests have weakened the zone; a break could lead to faster declines.
- Technical pressure: BTC below the 9-day EMA (~$114,814) and 50-day SMA (~$116,546) signals short- to mid-term bearish bias.
- Watch whales and volume: A 24,000 BTC sell and large whale holdings increase volatility risk; volume confirmation is essential for trend validation.
Conclusion
Bitcoin is facing elevated downside risk as it tests the $112K support band amid whale selloffs, weakening volume, and bearish EMA/SMA dynamics. Traders should front-load risk management: watch the 9-day EMA and $116,500 resistance for signs of a trend flip, and monitor on-chain whale activity closely. COINOTAG will continue to update this market view as new data emerges.