Bitget App
Trade smarter
Buy cryptoMarketsTradeFuturesEarnWeb3SquareMore
Trade
Spot
Buy and sell crypto with ease
Margin
Amplify your capital and maximize fund efficiency
Onchain
Going Onchain, without going Onchain!
Convert
Zero fees, no slippage
Explore
Launchhub
Gain the edge early and start winning
Copy
Copy elite trader with one click
Bots
Simple, fast, and reliable AI trading bot
Trade
USDT-M Futures
Futures settled in USDT
USDC-M Futures
Futures settled in USDC
Coin-M Futures
Futures settled in cryptocurrencies
Explore
Futures guide
A beginner-to-advanced journey in futures trading
Futures promotions
Generous rewards await
Overview
A variety of products to grow your assets
Simple Earn
Deposit and withdraw anytime to earn flexible returns with zero risk
On-chain Earn
Earn profits daily without risking principal
Structured Earn
Robust financial innovation to navigate market swings
VIP and Wealth Management
Premium services for smart wealth management
Loans
Flexible borrowing with high fund security
ETH Inflows Smash Bitcoin: Price Breakout Coming?

ETH Inflows Smash Bitcoin: Price Breakout Coming?

CryptotickerCryptoticker2025/08/28 09:30
By:Cryptoticker

Ethereum price just got its biggest validation yet. Over the past week, spot Ether ETFs in the US have pulled in more than $1.8 billion in inflows, outpacing spot Bitcoin ETFs by a factor of ten. Investors are voting with their wallets, and right now they’re choosing ETH over BTC. The question is whether this enthusiasm can fuel another leg up in Ethereum’s price , which is currently trading around $4,550.

Ethereum ETF Inflows vs Market Sentiment


When new financial products attract such strong demand, it signals that institutional and retail investors alike are building confidence in the asset. The fact that ETH ETFs are bringing in ten times more inflows than Bitcoin funds highlights a shift in perception: Ethereum is no longer playing second fiddle. This capital flow builds liquidity, lowers volatility over time, and sets up ETH ETF as a stronger competitor to Bitcoin as a store of value and yield-generating asset.

Ethereum Price Prediction: Is ETH Price Ready for a Breakout?

ETH Inflows Smash Bitcoin: Price Breakout Coming? image 0 
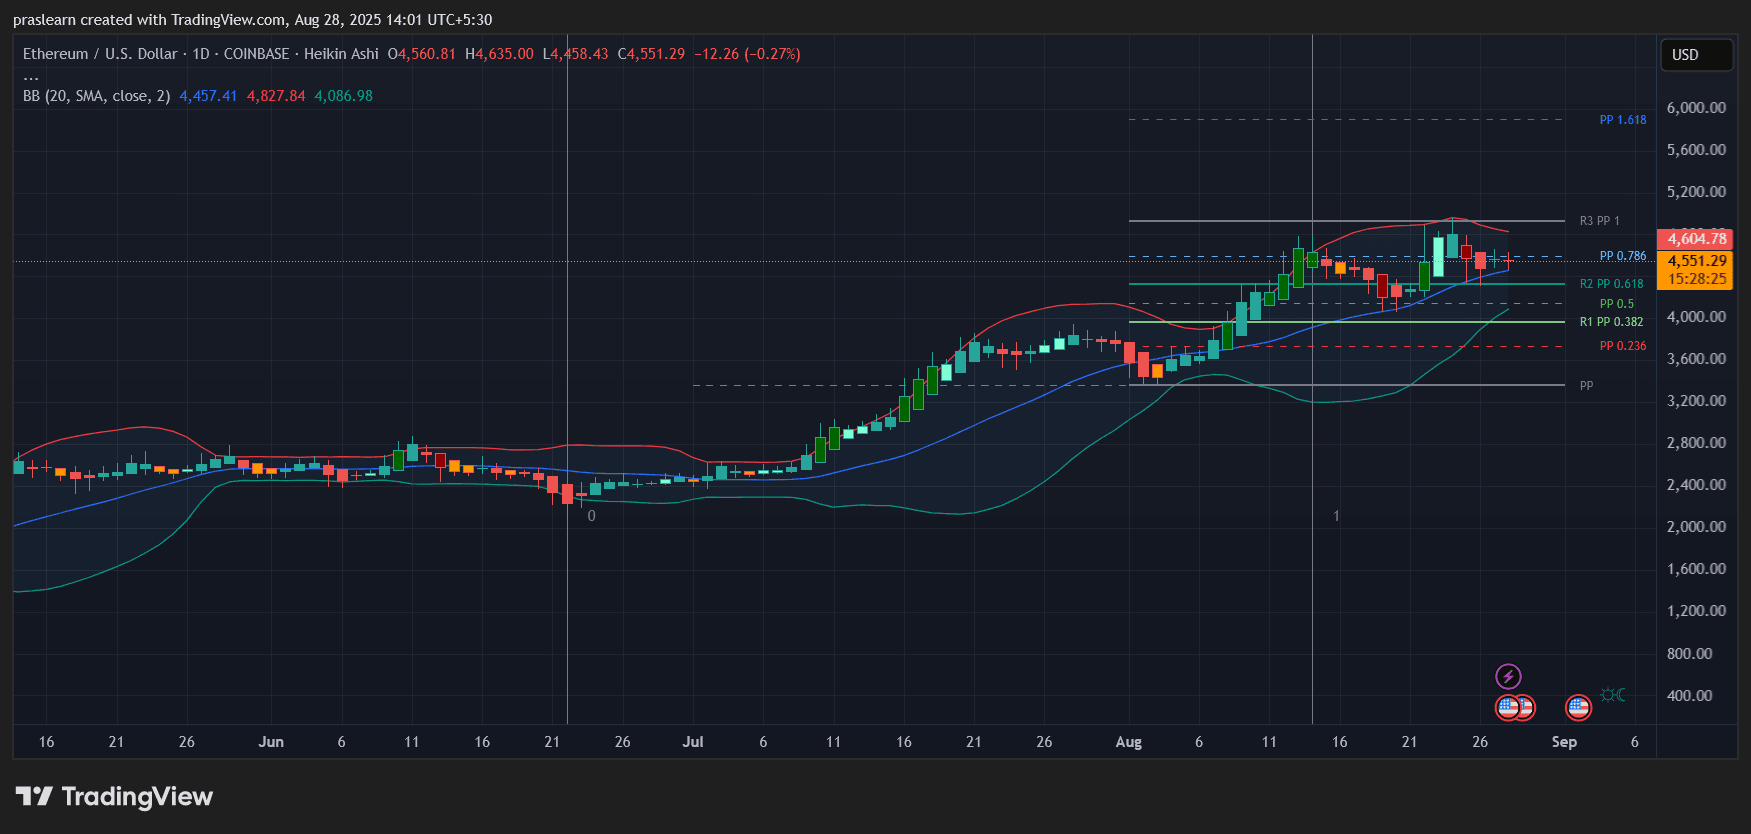
ETH/USD Daily Chart- TradingView

Looking at the daily chart, ETH price is consolidating just under resistance at the $4,600–$4,700 zone. Bollinger Bands are tightening after a strong rally in August, which typically precedes a sharp move. The price is holding above the mid-band ($4,450), showing bulls are still in control.

The Fibonacci retracement levels from the recent swing indicate $4,300 as strong support and $5,200 as the next upside target. If inflows continue, ETH could retest $5,000 in the short term and potentially aim for $5,600 (the 1.618 Fibonacci extension).

Why This Inflow Surge Matters More Than Price Action Alone

Unlike speculative rallies, Ethereum ETF i nflows represent sticky institutional capital. These investors typically hold longer-term positions, meaning the $1.83 billion isn’t hot money that disappears overnight. If this momentum continues, Ethereum’s narrative as both an infrastructure play and an investment-grade asset strengthens. In simple terms, the floor for ETH price gets higher with every billion flowing in.

Ethereum Price Prediction: Can ETH Price Break Into a New Range?

Given the chart structure and the ETF-driven demand, $Ethereum looks set for a bullish continuation. Short-term pullbacks toward $4,300 should be seen as healthy resets, not signs of weakness. If Ethereum ETF inflows maintain their current pace, ETH price has a strong chance of reclaiming $5,000 within weeks and pushing toward $5,200–$5,600 before September ends.

Unless inflows dry up or macro conditions reverse sharply, the balance of probability points to $ETH rising further. Bitcoin may still lead the market, but Ethereum just proved it can dominate the inflow race—and that’s a bullish shift investors can’t ignore.

0

Disclaimer: The content of this article solely reflects the author's opinion and does not represent the platform in any capacity. This article is not intended to serve as a reference for making investment decisions.

PoolX: Earn new token airdrops
Lock your assets and earn 10%+ APR
Lock now!

You may also like

Silver's New Dawn: Geopolitical Turmoil and Green Energy Fuel a Bull Market

- Silver faces historic transformation in 2025 due to geopolitical shocks, U.S.-China tensions, and green energy demand surge. - Mexico's production decline and Russia's BRICS-focused isolation create 206M-ounce structural deficit, the largest on record. - Solar PV (24% of industrial use) and EVs drive 50% industrial demand growth by 2030, outpacing inelastic supply from mining byproducts. - Mining equities (AGSV, VZLA) and ETPs gain traction as silver's gold-to-silver ratio (1:90) signals undervaluation a

ainvest2025/08/28 16:15
Silver's New Dawn: Geopolitical Turmoil and Green Energy Fuel a Bull Market

Gold Price: Strategic Diversification in Decentralized Decision-Making Environments

- Decentralized governance models in 2025 drive systemic risk diversification, elevating gold as a strategic hedge against geopolitical and macroeconomic volatility. - Industrial giants and emerging economies boost gold reserves, leveraging its dual role in supply chains and portfolios amid dollar erosion and sanctions. - Gold prices surge past $3,300/ounce as investors adopt 10–15% allocations, reflecting structural demand from BRICS initiatives and pension fund reforms. - Central bank gold accumulation,

ainvest2025/08/28 16:15
Gold Price: Strategic Diversification in Decentralized Decision-Making Environments

HOME +624.5% in 24 Hours Amid Sharp Short-Term Volatility

- HOME token surged 624.5% in 24 hours to $0.04023 amid sharp short-term volatility, contrasting with mixed longer-term performance. - Home Finance emphasized progress on decentralized lending protocols and governance tools to enhance cross-chain liquidity and holder control. - Analysts suggest the rally reflects temporary liquidity shifts rather than long-term reversal, with no signs of manipulation or institutional inflows. - Technical indicators show conflicting signals: overbought short-term momentum v

ainvest2025/08/28 16:13
HOME +624.5% in 24 Hours Amid Sharp Short-Term Volatility

PHB Surges 602.81% in 24 Hours Amid Market Volatility

- PHB surged 602.81% in 24 hours to $25.54, driven by social media momentum and niche ecosystem adoption. - Despite 1557.16% monthly gains, PHB faces 5420.83% annual drawdown, highlighting extreme volatility and retail-driven trading. - Technical indicators show overbought RSI and a golden cross, signaling potential $30.35 resistance test but cautioning against long-term risks. - Backtested trend-following strategies captured recent gains but incurred sharp drawdowns, emphasizing need for rapid execution a

ainvest2025/08/28 16:13
PHB Surges 602.81% in 24 Hours Amid Market Volatility