Bitget App
Trade smarter
Buy cryptoMarketsTradeFuturesEarnWeb3SquareMore
Trade
Spot
Buy and sell crypto with ease
Margin
Amplify your capital and maximize fund efficiency
Onchain
Going Onchain, without going Onchain!
Convert
Zero fees, no slippage
Explore
Launchhub
Gain the edge early and start winning
Copy
Copy elite trader with one click
Bots
Simple, fast, and reliable AI trading bot
Trade
USDT-M Futures
Futures settled in USDT
USDC-M Futures
Futures settled in USDC
Coin-M Futures
Futures settled in cryptocurrencies
Explore
Futures guide
A beginner-to-advanced journey in futures trading
Futures promotions
Generous rewards await
Overview
A variety of products to grow your assets
Simple Earn
Deposit and withdraw anytime to earn flexible returns with zero risk
On-chain Earn
Earn profits daily without risking principal
Structured Earn
Robust financial innovation to navigate market swings
VIP and Wealth Management
Premium services for smart wealth management
Loans
Flexible borrowing with high fund security
Bonk (BONK) To Bounce Back? Key Harmonic Pattern Hints Potential Reversal

Bonk (BONK) To Bounce Back? Key Harmonic Pattern Hints Potential Reversal

CoinsProbeCoinsProbe2025/08/30 22:35
By:Nilesh Hembade

Date: Sat, Aug 30, 2025 | 05:30 AM GMT

The cryptocurrency market has once again entered choppy waters as Ethereum (ETH) slipped to $4,350 from its recent high of $4,954, marking a 7% weekly decline. The pullback has pressured major memecoins , including Solana-based Bonk (BONK).

However, BONK showed relative strength today with a 5% intraday jump, trimming its weekly losses to just 3%. More importantly, the price chart is signaling a harmonic pattern setup that could pave the way for a potential bounceback.

Bonk (BONK) To Bounce Back? Key Harmonic Pattern Hints Potential Reversal image 0 Source: Coinmarketcap

Harmonic Pattern Taking Shape

On the daily chart, BONK appears to be forming a Bearish ABCD harmonic pattern. Despite its bearish name, this pattern often involves a strong bullish CD-leg rally before the token approaches its Potential Reversal Zone (PRZ).

The structure kicked off with a rally from Point A near $0.00001142 up to Point B, followed by a retracement to Point C around $0.00001956, where buyers stepped in near the 200-day moving average (MA). Since then, BONK has shown resilience, climbing back to around $0.00002260, suggesting the CD leg may now be in motion.
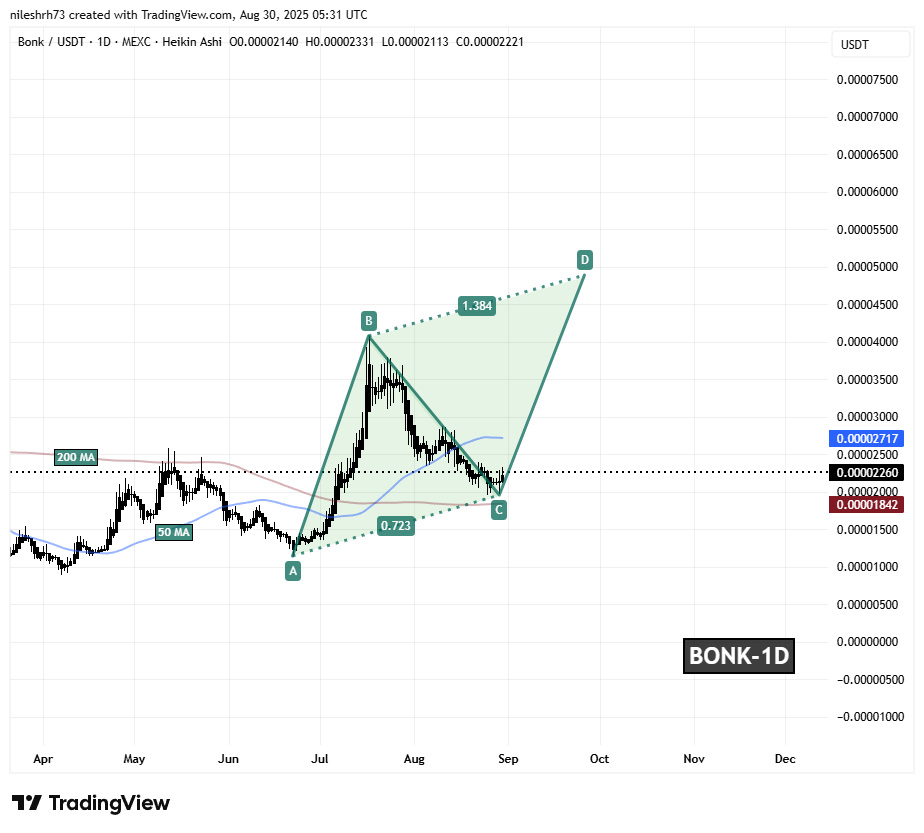
Bonk (BONK) To Bounce Back? Key Harmonic Pattern Hints Potential Reversal image 1 Bonk (BONK) Daily Chart/Coinsprobe (Source: Tradingview)

Critically, BONK is approaching its 50-day MA resistance at $0.00002717. A decisive breakout above this zone could validate the harmonic setup and trigger fresh momentum buying.

What’s Next for BONK?

If bulls manage to push BONK above the 50-day MA, the token could rally toward the 1.38 Fibonacci PRZ at $0.00004890, implying a potential upside of over 116% from current levels.

On the flip side, if BONK loses ground and closes below the 200-day MA support near $0.00001842, the harmonic structure could be invalidated, opening the door to further downside pressure.

0

Disclaimer: The content of this article solely reflects the author's opinion and does not represent the platform in any capacity. This article is not intended to serve as a reference for making investment decisions.

PoolX: Earn new token airdrops
Lock your assets and earn 10%+ APR
Lock now!

You may also like

The Reflection Effect and Ethereum Volatility: Decoding Investor Psychology for Smarter Trading Strategies

- Ethereum's volatility stems from the reflection effect, where investors shift risk preferences between gains and losses, amplifying market swings. - Fidelity's FETH ETP exacerbates this dynamic by reducing cognitive load, enabling emotion-driven trading that outpaces Ethereum's price movements. - Weekly patterns show heightened volatility on Tuesdays/Wednesdays, with Mondays reflecting compounded sentiment and Fridays acting as emotional reset points. - Strategic counter-cyclical trading using Fear & Gre

ainvest2025/08/31 17:21
The Reflection Effect and Ethereum Volatility: Decoding Investor Psychology for Smarter Trading Strategies

Shares Silver Trust: A Behavioral Finance Lens on Contrarian Opportunities in a Volatile Market

- The iShares Silver Trust (SLV) reflects investor behavioral biases, notably the reflection effect, driving volatile price swings in 2025 amid geopolitical risks and market sentiment shifts. - Silver’s dual role as monetary and industrial asset amplifies its sensitivity to psychological triggers, with structural supply deficits and rising industrial demand (e.g., solar, EVs) creating a strong price floor. - Contrarian investors capitalize on SLV’s oversold technical indicators (RSI 24.84) and a bullish "g

ainvest2025/08/31 17:21
Shares Silver Trust: A Behavioral Finance Lens on Contrarian Opportunities in a Volatile Market

Solana News Today: Whales and Retailers Fuel BlockDAG's Deflationary Rise in 2025

- BlockDAG, a hybrid DAG-PoW blockchain, raised $387M in presale with 2,900% ROI potential for early investors. - Its 15,000 TPS capacity and EVM compatibility attract 4,500+ developers, outperforming Ethereum and XRP in scalability. - 2.5M X1 app users and 19,300 ASIC miners drive adoption, while partnerships with Inter Milan and Seattle Orcas expand mainstream reach. - Institutional-grade security audits and $10M+ whale investments position BlockDAG to compete with Ethereum/Solana via 20+ confirmed excha

ainvest2025/08/31 17:18
Solana News Today: Whales and Retailers Fuel BlockDAG's Deflationary Rise in 2025