Cardano (ADA) price has slipped below the $0.8221 support, trading near $0.8202; immediate downside targets are $0.81–$0.8150, with a bearish extension to $0.75–$0.70 if weekly closes remain under $0.80.
-
Immediate support: $0.8221 — breached on the hourly chart
-
Short-term target: $0.81–$0.8150 if daily close confirms weakness
-
Midterm risk: $0.75 and $0.70 zones if weekly close drops below $0.80 (data via CoinStats, TradingView)
Cardano price falls below $0.8221; ADA price outlook shows risk of declines to $0.75–$0.70. Read full ADA price analysis and trade signals — stay informed.
The crypto market is attempting to hold modest gains, but Cardano (ADA) is an exception as sellers press short-term advantage, according to CoinStats.
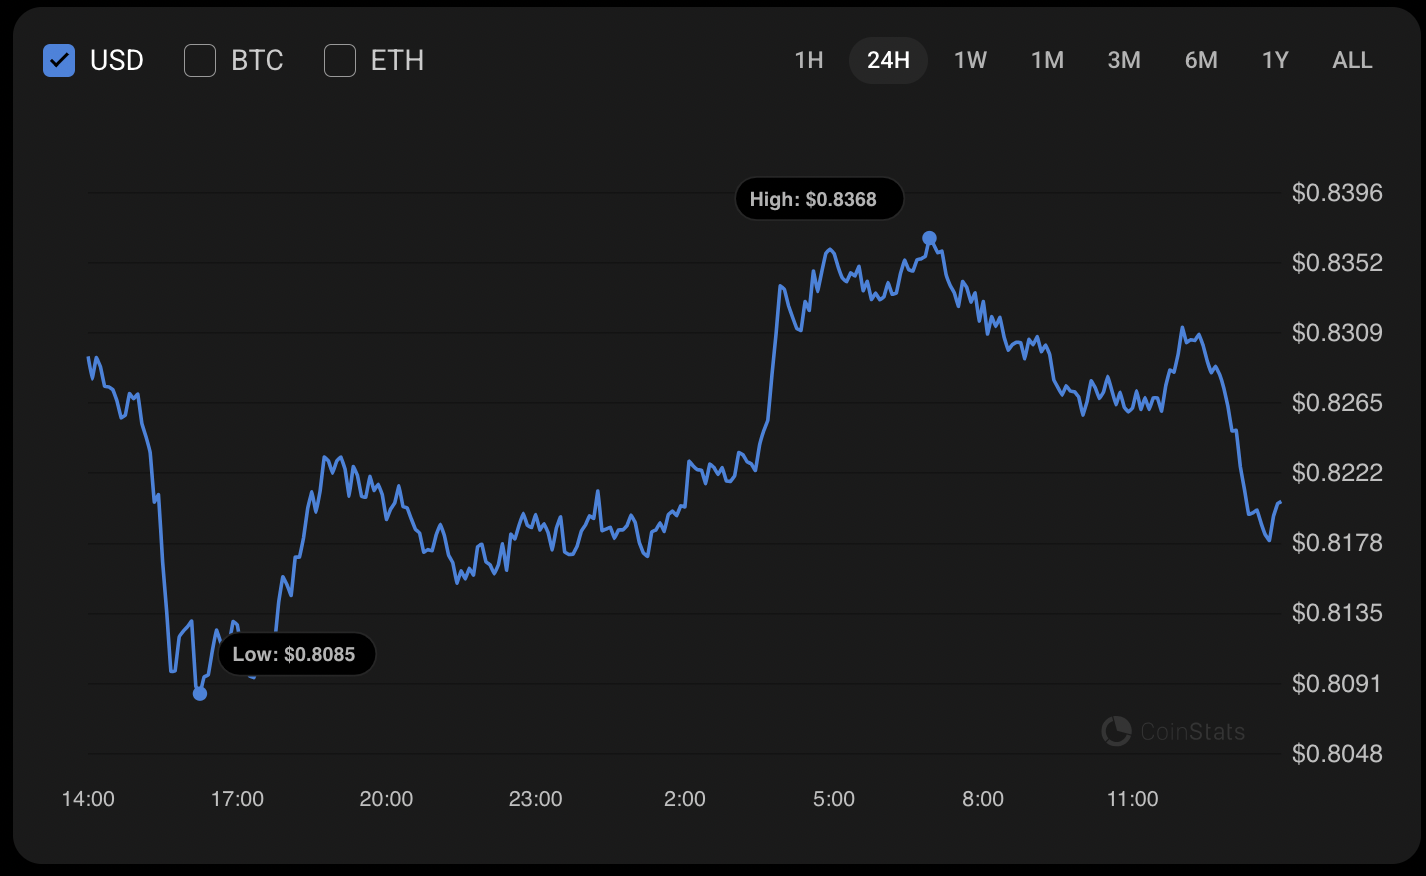
ADA chart by CoinStats
What is the current Cardano price outlook?
Cardano price has fallen below the hourly support of $0.8221, trading around $0.8202 at press time. If daily candles close weak, expect a short-term target of $0.81–$0.8150, with deeper downside to $0.75–$0.70 possible on continued selling pressure.
How has ADA traded over the last 24 hours?
ADA has declined about 1.08% in the past 24 hours. On the hourly chart the price has fixed below local support at $0.8221, signaling a near-term advantage for sellers. Trading data and chart visuals referenced from CoinStats and TradingView provide the basis for these levels.
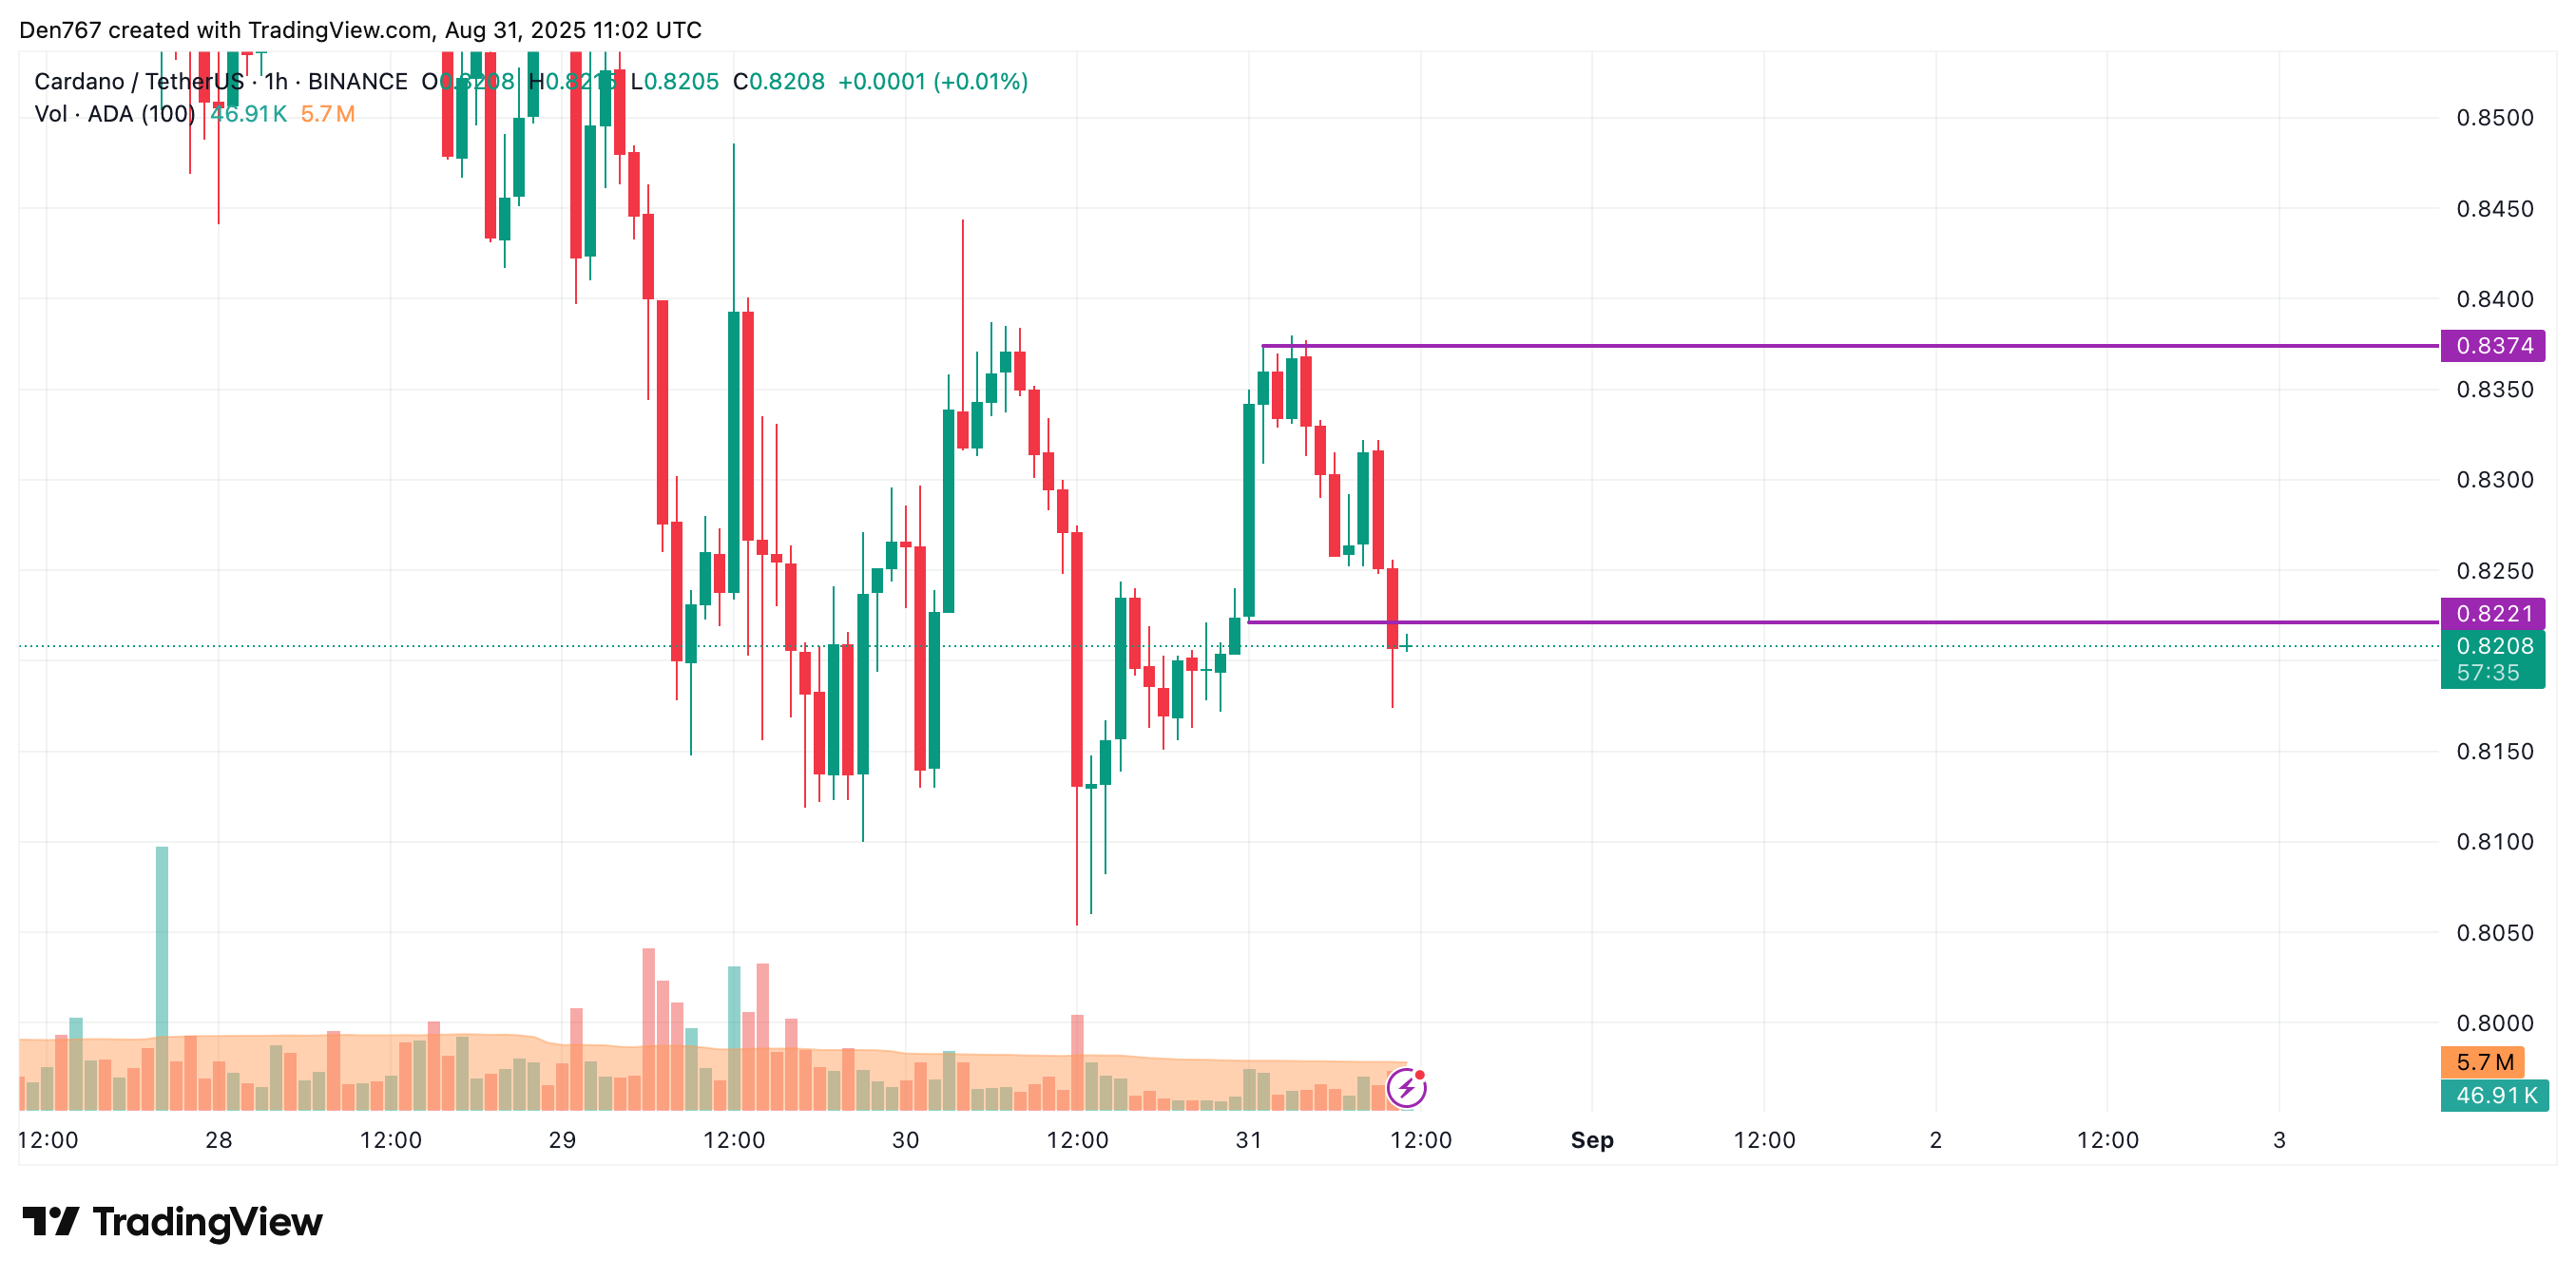
Image by TradingView
If the daily bar closes away from $0.8221 and shows little buying wick, a move into the $0.81–$0.8150 band is likely. Market participants should watch the daily close for confirmation before increasing short exposure.
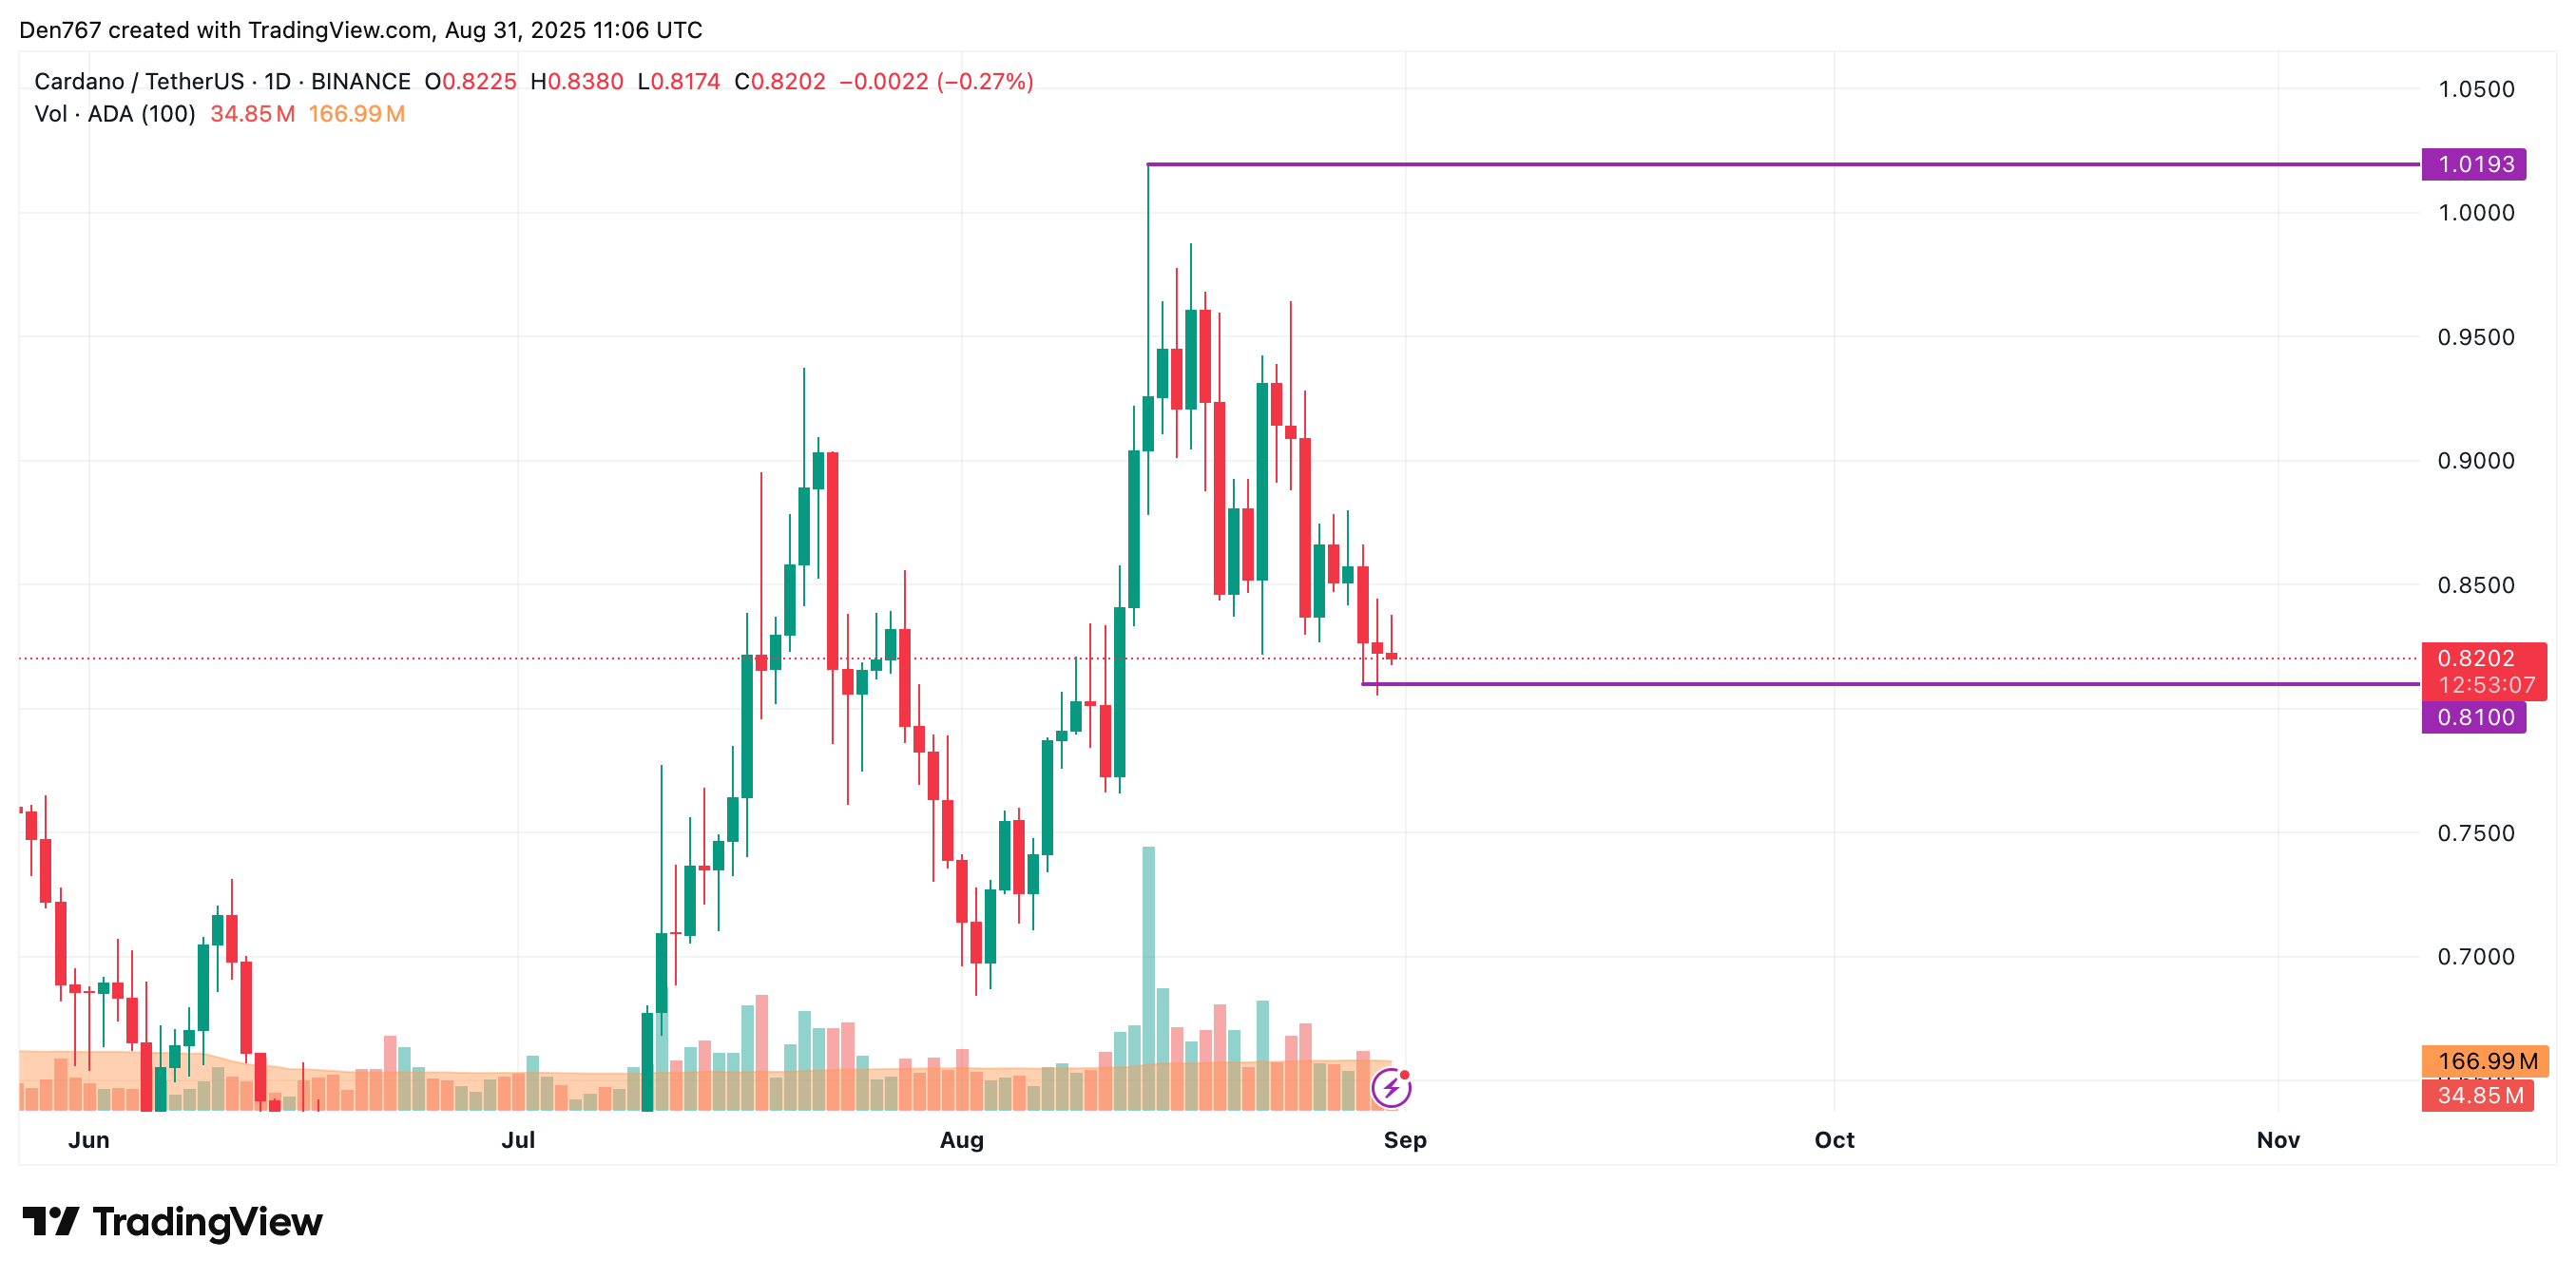
Image by TradingView
Why could ADA test $0.75 or $0.70?
On larger timeframes, sellers display greater momentum than buyers. If bulls fail to defend the $0.821 mark, accumulated selling pressure could trigger a test of the $0.75 zone. That scenario remains relevant through next week, absent bullish reversal signals.
From a midterm perspective there are no clear reversal signals. Focus remains on the interim area of $0.80; a weekly close below this level would materially increase the chance of a decline toward the $0.70 range.
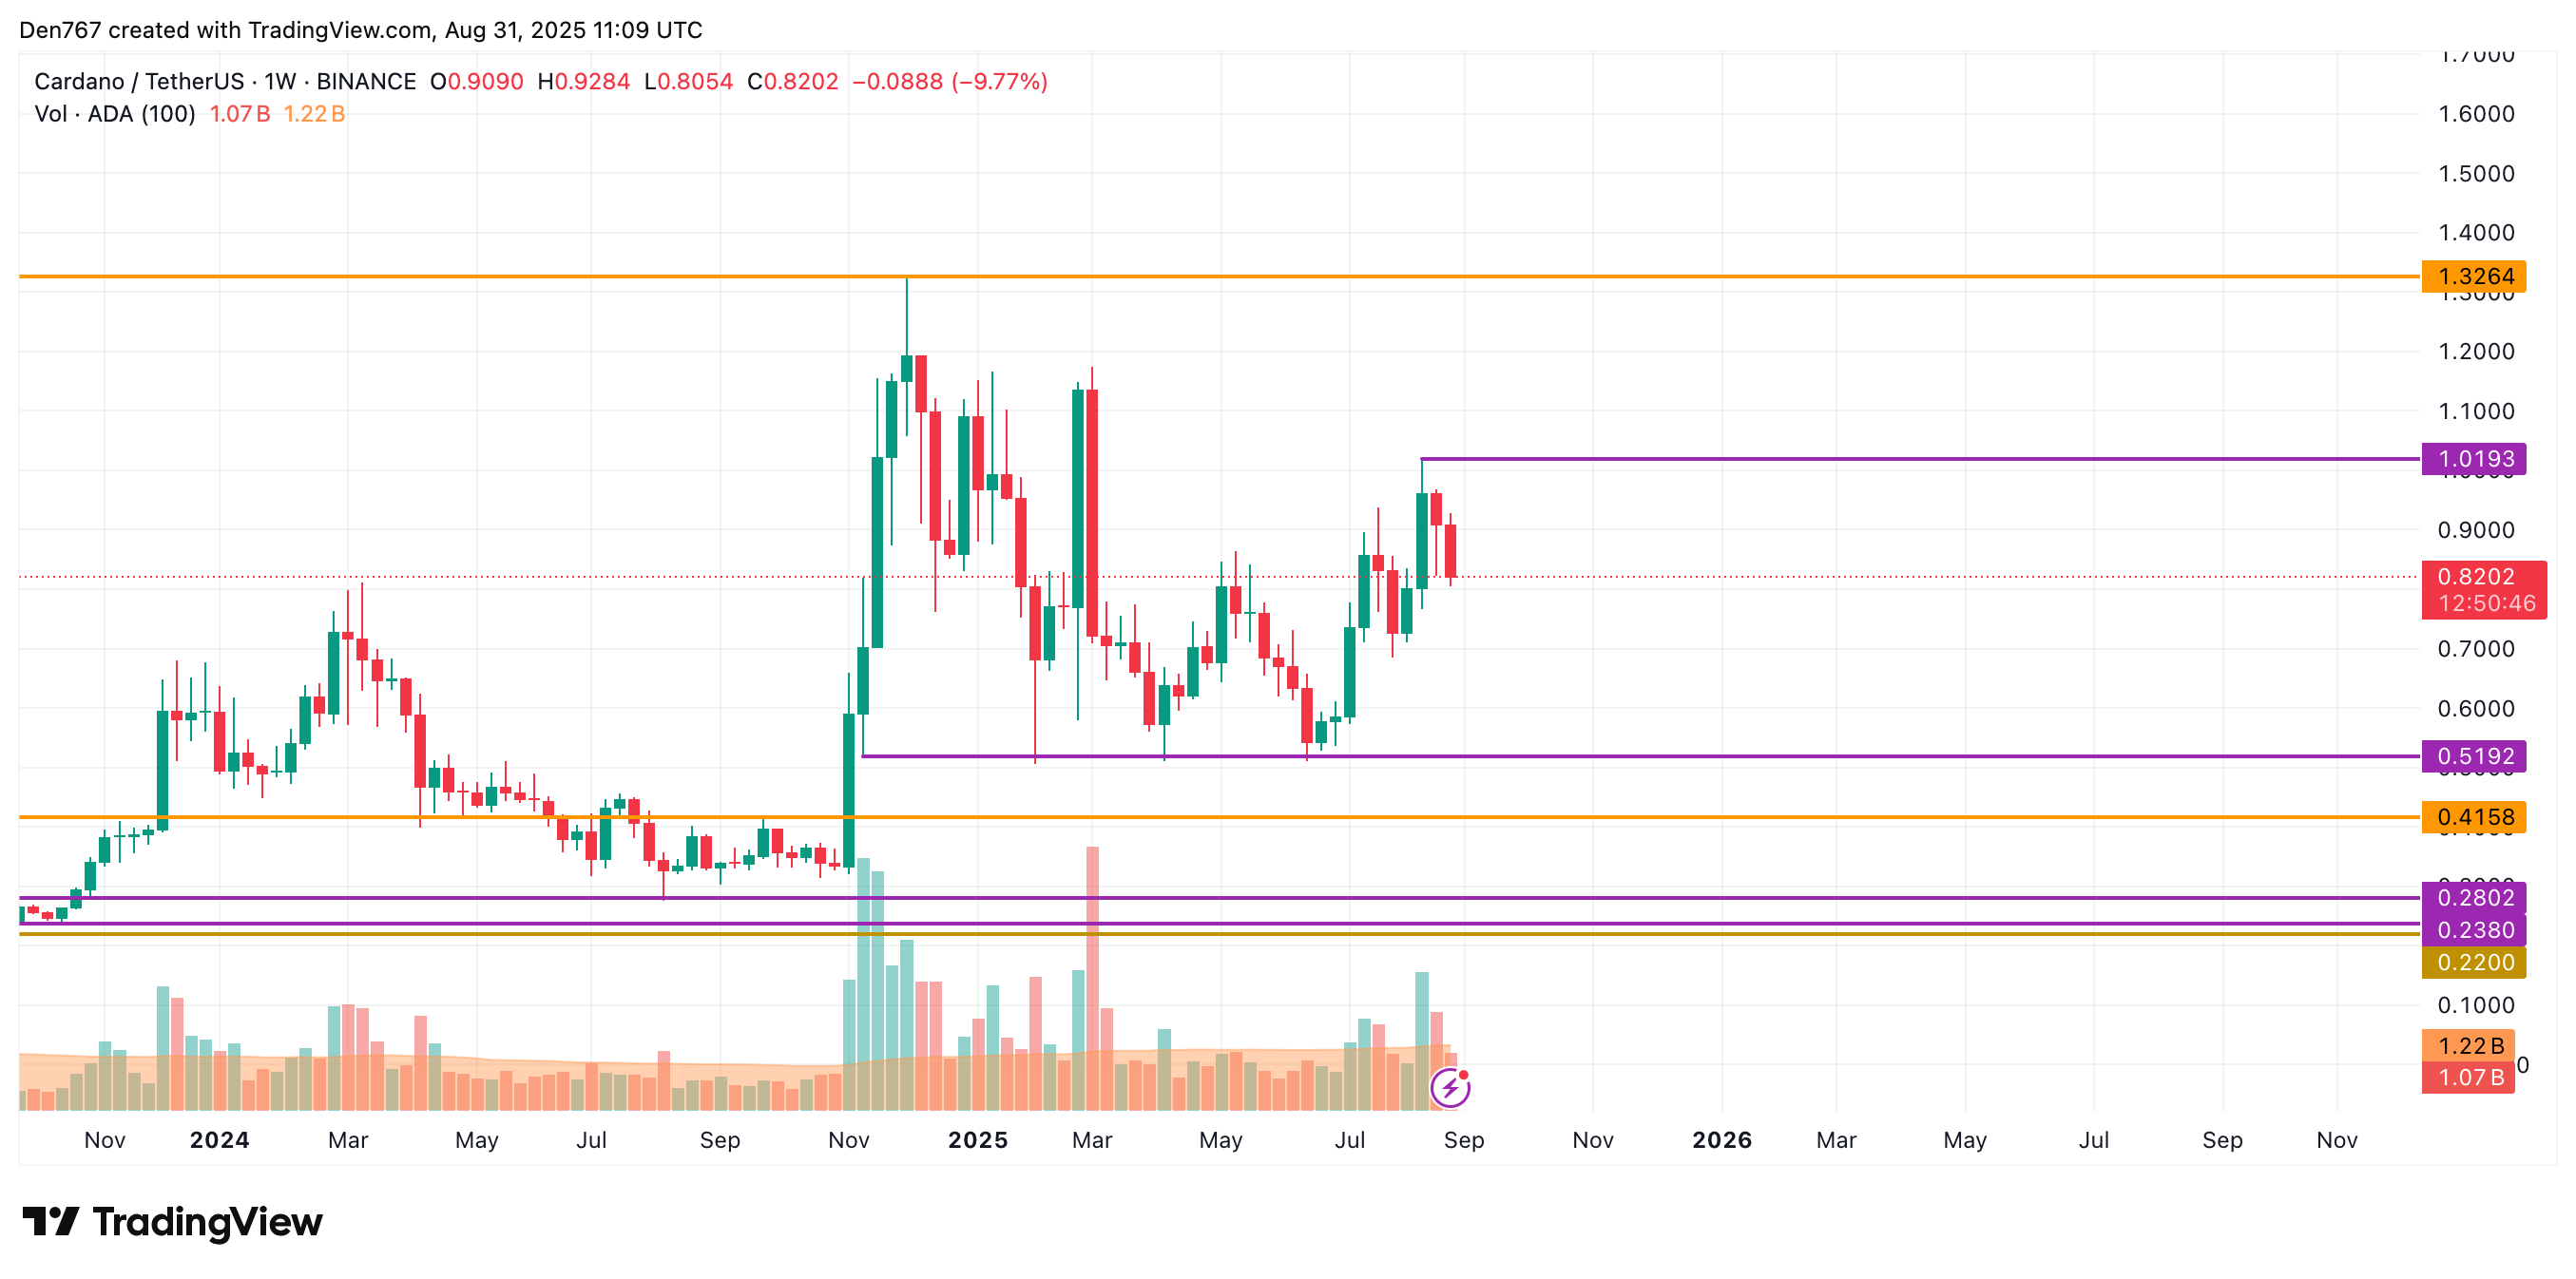
Image by TradingView
ADA is trading at $0.8202 at press time. Traders should use confirmed closes on hourly, daily, and weekly timeframes to validate moves and manage risk with defined stop-loss levels.
Frequently Asked Questions
What short-term support should traders watch for ADA?
Traders should watch $0.8221 (hourly), then $0.81–$0.8150 as the next support band. A daily close below $0.8221 increases short-term downside probability.
How should I set risk if I trade ADA now?
Use tight stops above recent swing highs if shorting, or place stops below $0.80 if holding long-term exposure. Adjust position size to limit downside risk to a predefined percentage of capital.
Key Takeaways
- Breached support: ADA fell under $0.8221 on the hourly chart, signaling near-term bearish bias.
- Short-term target: $0.81–$0.8150 if the daily close confirms weakness.
- Midterm risk: Weekly close below $0.80 could lead to tests of $0.75 and $0.70; monitor weekly candle structure.
Conclusion
This ADA price update shows a cautious outlook: front-loaded indicators point to further downside unless bulls reclaim $0.8221 and weekly closes stabilize above $0.80. Continue to monitor hourly, daily, and weekly closes and use proper risk management; COINOTAG will provide updates as conditions develop.


