SUI Bulls Target $3.50 After A Breakout From This Key Chart Pattern

In a significant move for the SUI market, bulls have successfully broken out of a key technical chart pattern, setting their sights on the next major resistance level at $3.50. This breakout signals a shift in momentum, as the price action re-establishes a clear upward trend.
Technical Setup Signals Room For Further Upside
Crypto VIP Signal, in a recent update on X, highlighted that SUI has sustained its bullish momentum exactly as anticipated, successfully breaking out of the falling wedge pattern. This breakout is a strong technical signal often associated with trend reversals, suggesting that the token has shifted from a period of consolidation into a phase of renewed upward strength. Such a move indicates that market sentiment is leaning toward optimism, with buyers steadily reclaiming control.
The update further explained that following the breakout, SUI retested the support line, a critical step in confirming the validity of the breakout. Holding this support level firmly not only reinforces the bullish structure but also builds a stronger foundation for future gains. This development underscores the resilience of SUI’s price action, as it demonstrates the ability of the market to absorb selling pressure while maintaining upward momentum.
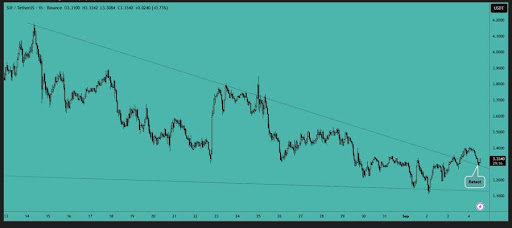
Looking ahead, Crypto VIP Signal pointed to $3.50 as the next key resistance level that traders and investors should keep an eye on. If this level is broken, it would likely attract more buyers into the market, creating the conditions for SUI to extend its upward trajectory and establish new short-term highs.
SUI Indicators Align For Potential Upside Continuation
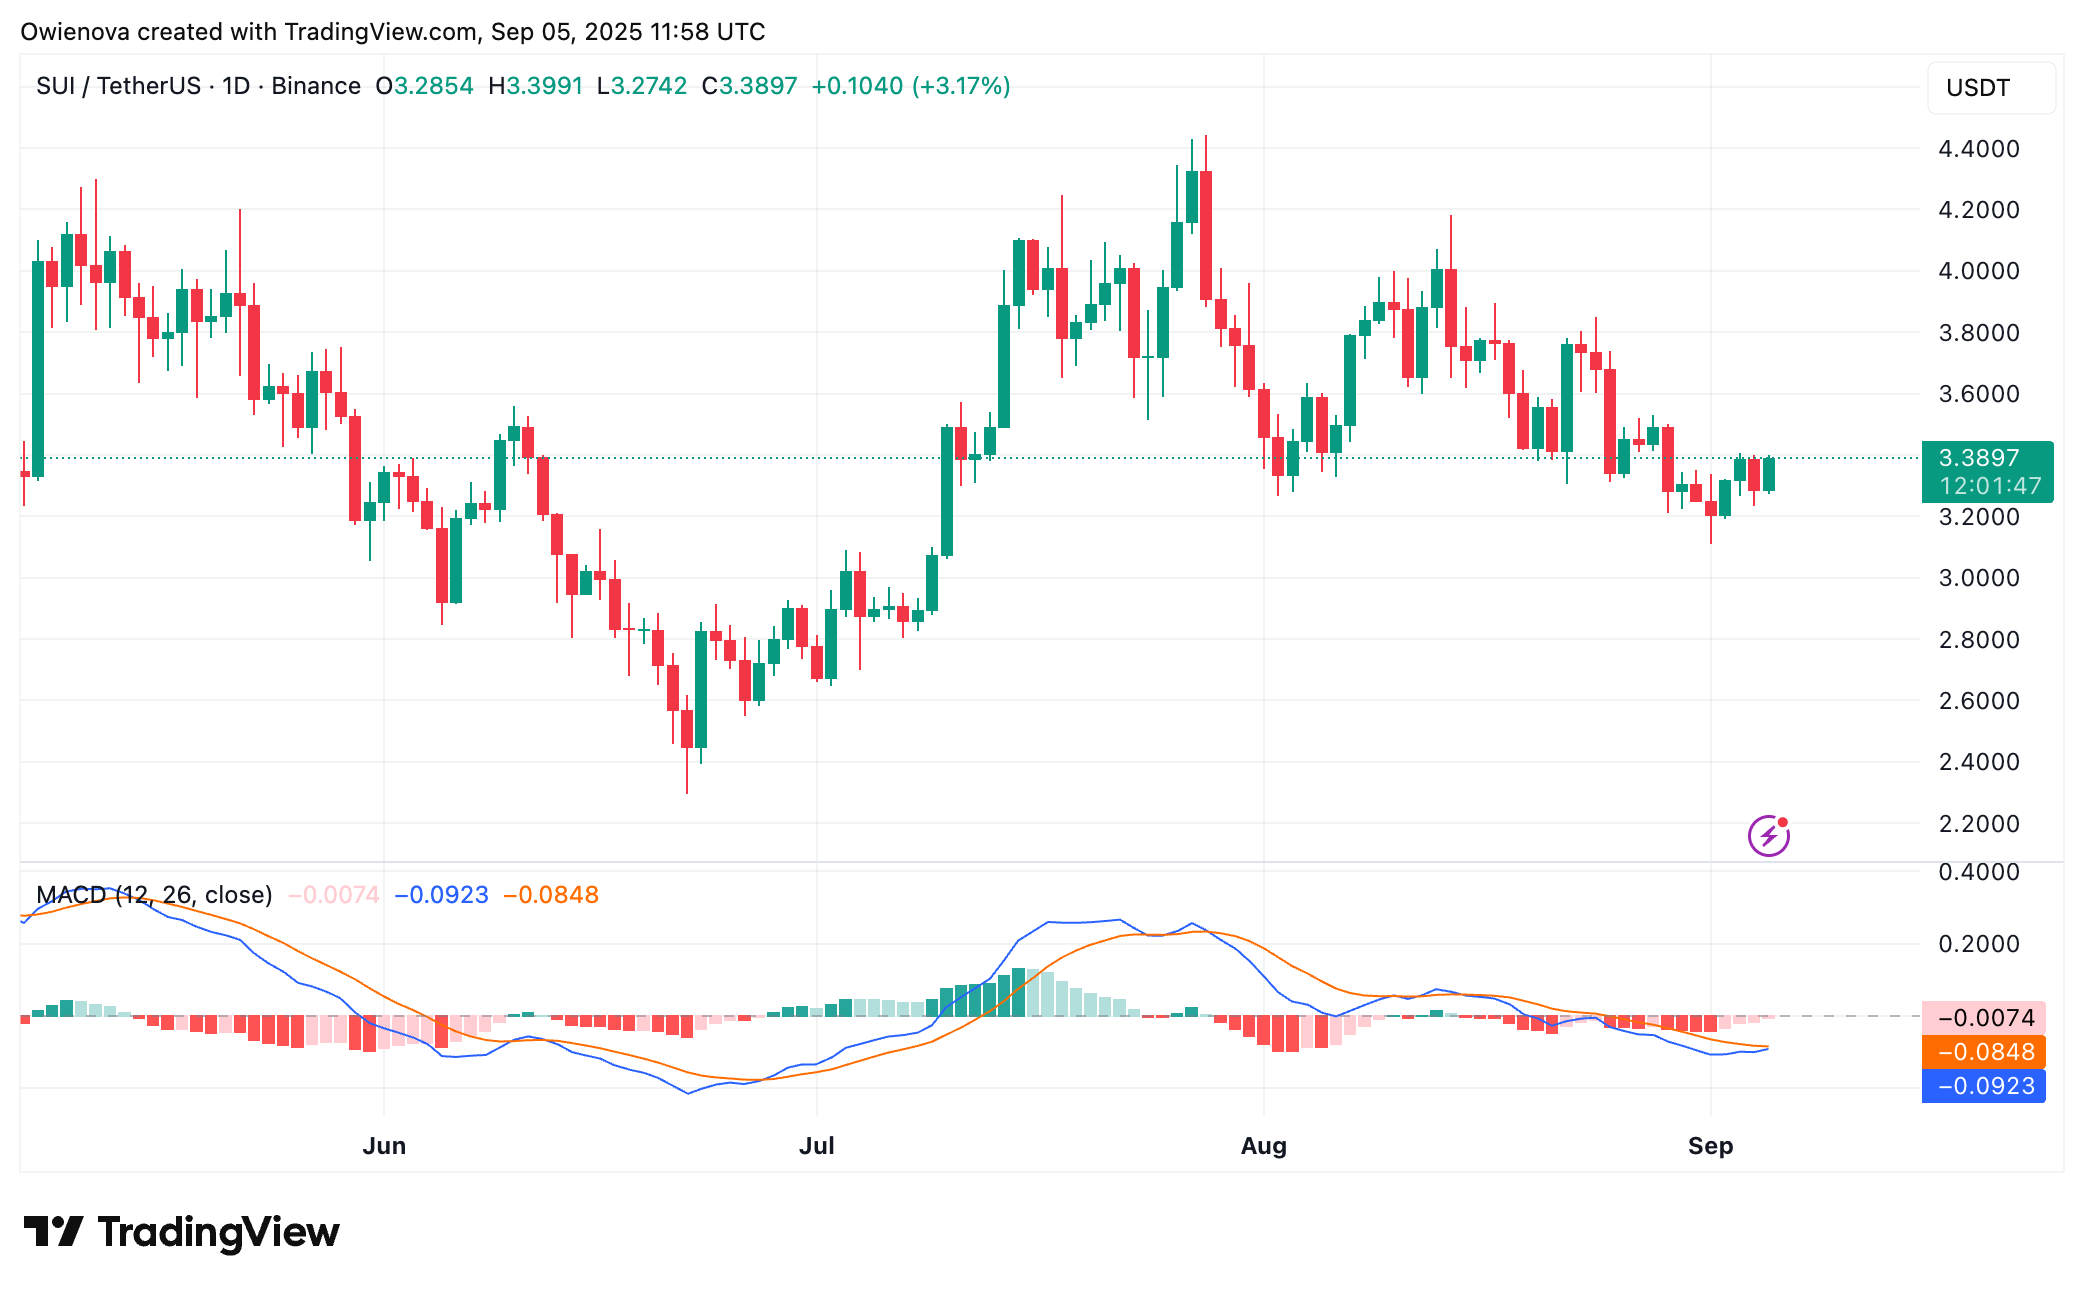
Adding to the growing bullish outlook for SUI, Gemxbt recently emphasized in a post that the token is showing signs of a strong reversal. The analysis revealed that SUI’s price has crossed above both the 5-day and 10-day moving averages, which strengthens the case for continued upward pressure in the near term.
Resistance is currently positioned near $3.35, a zone that will play a pivotal role in determining whether SUI can maintain its bullish breakout. On the downside, strong support is established around $3.20, serving as a safety net in case of short-term pullbacks. Holding this support will be essential for sustaining market confidence.
In addition to these key levels, momentum indicators are also aligning with the current bullish narrative. The RSI has begun rising from oversold territory, signaling renewed buying interest, while the MACD has confirmed a bullish crossover. Together, these technical signals suggest that SUI could be gearing up for another upward push, with momentum building toward testing and possibly breaking above the next resistance barrier.
Disclaimer: The content of this article solely reflects the author's opinion and does not represent the platform in any capacity. This article is not intended to serve as a reference for making investment decisions.
You may also like
samczsun: The Key to Crypto Protocol Security Lies in Proactive Re-Auditing
Bug bounty programs are passive measures, while security protection requires proactive advancement.

Millennials with the most cryptocurrency holdings are reaching the peak of divorce, but the law is not yet prepared.
The biggest problem faced by most parties is that they have no idea their spouse holds cryptocurrency.

Using "zero fees" as a gimmick, is Lighter's actual cost 5–10 times higher?
What standard accounts receive from Lighter is not free trading, but rather slower transactions. This delay is turned into a source of profit by faster participants.

Prize pool of 60,000 USDT, “TRON ECO Holiday Odyssey” annual ecological exploration event is about to begin
TRON ECO is launching a major ecosystem collaboration event during Christmas and New Year, offering multiple luxurious benefits across the entire ecosystem experience!