Date: Fri, Sept 26, 2025 | 07:20 AM GMT
The cryptocurrency market continues to face heavy retracement, with Bitcoin (BTC) and Ethereum (ETH) both posting weekly losses. Ethereum, in particular, has slipped more than 13%, breaking below the $3,950 level. As pressure spreads across the major altcoins, layer-1 token Sui (SUI) has also come under fire.
Over the past week, SUI has dropped by 17%. But despite the selloff, its chart is highlighting a crucial technical setup that could dictate the token’s next big move.
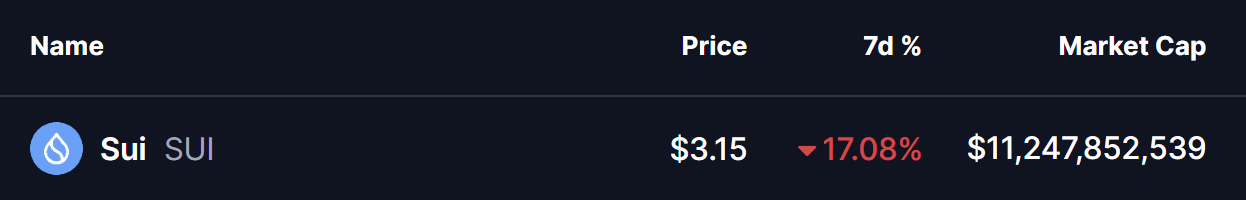 Source: Coinmarketcap
Rising Wedge in Play
On the daily chart, SUI has been consolidating within a rising wedge — a pattern often viewed as bearish since it typically leads to breakdowns after an extended rally. Prices have been carving out higher highs and higher lows, but within narrowing boundaries.
In late July, SUI was rejected at the wedge’s upper resistance trendline near $4.42, sparking a steep correction. That move has now dragged the token down toward the wedge’s lower boundary at around $3.07, which also aligns closely with the 200-day moving average at $3.20.
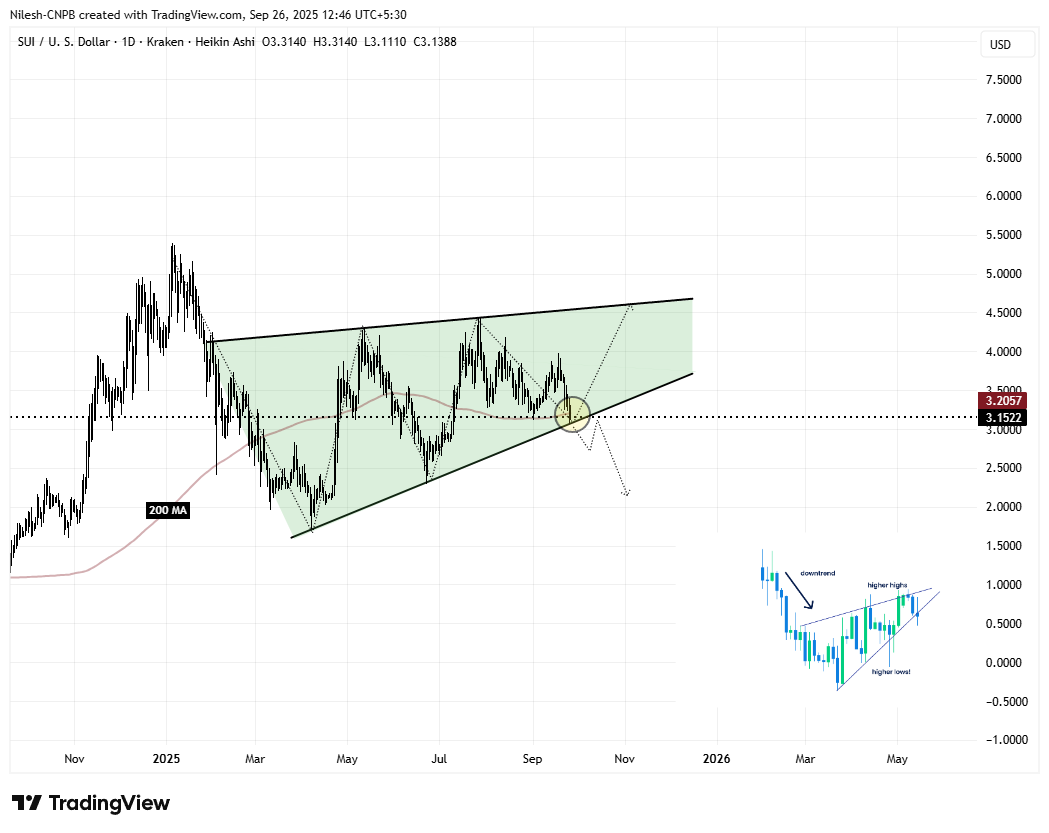 Sui (SUI) Daily Chart/Coinsprobe (Source: Tradingview)
This region is significant. Since April, the lower wedge trendline has acted as dynamic support throughout SUI’s broader uptrend. Bulls will need to defend it once again to prevent a deeper breakdown.
What’s Next for SUI?
At the time of writing, SUI trades near $3.15. If buyers can hold the $3.07 support area and reclaim levels above the 200-day moving average, momentum could shift back in their favor. In that scenario, SUI has room to rebound toward the wedge’s upper resistance zone near $3.60.
On the flip side, a decisive breakdown below the support trendline would confirm the wedge failure. Such a move could open the door for a deeper decline, potentially retesting the $2.33 support zone, a level not seen since June.
Whether SUI rebounds or breaks down will largely depend on how it reacts to this crucial trendline in the coming sessions.