Multiple indicators of the S&P Index signal a correction, beware of downside risk!

(This article includes a classic case analysis: Weibo_WB.)
I. Weekly Market Review: (09.22~09.26)
This week, the opening price was 6654.28 points, the lowest point on Wednesday was 6569.22 points, the highest point on Friday was 6699.52 points, and the final closing price was 6643.70 points. The weekly amplitude was 1.96%, with a decline of 0.31%. The weekly candlestick chart showed a bearish "doji" K-line, closing above the 5-week moving average and setting a new historical high for the S&P 500 index. In the S&P 500 component stock gain and loss rankings this week, Intel ranked first with a gain of 20.01%, while CarMax ranked last with a decrease of 23.22%. The average price change of component stocks was 0.07%, and the average price change of all US stocks this week was -0.72%.
From April 7 to September 26, the index has risen for 25 consecutive weeks, totaling 120 trading days, with a cumulative maximum increase of about 38.56%.
S&P 500 Index Weekly Chart: (Momentum Quantitative Model * Sentiment Quantitative Model)
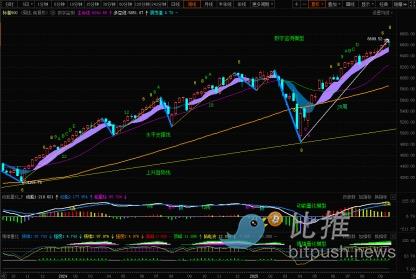
(Figure 1)
S&P 500 Index Daily Chart:
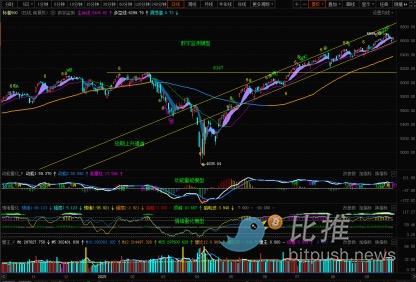
(Figure 2)
S&P 500 Index Weekly Chart: (Historical Data Backtest: March 6, 2009 to April 4, 2025)
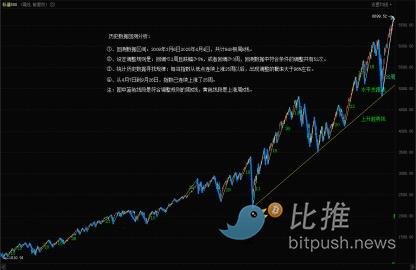
(Figure 3)
The title of my article last week was "Mainly Hold Above the Lifeline, Beware of Wide Intraday Fluctuations!" In the article, based on multi-cycle technical indicator resonance and more than a decade of historical data backtesting, I made predictions for this week's index.
Regarding the index trend:
The index is still operating within the upward channel formed after May 2. Be alert for wide intraday fluctuations. The upward resistance is near the upper boundary of the channel; the first support below is near the lower boundary of the channel, the second support is around 6300 to 6340 points, and the key support is in the 6200 to 6147 points area.
Regarding trading strategies:
1. Although the weekly momentum high-level stagnation signal has disappeared, the daily level and other indicators still show a relatively high downside risk index, and the upward cycle has lasted for 24 consecutive weeks, so a cautious attitude should be maintained in operations.
2. Total position: Increase long positions to about 70%. If the index falls below the lifeline channel, reduce the position to below 30%.
2. For short-term investors, about 20% of the position can be used to make "short-term trades" based on support and resistance levels.
Now, let's review the actual trend this week:
On Monday, the index opened slightly lower and then fluctuated upward, with trading volume shrinking rapidly compared to the previous day. A small bullish candlestick with a gain of 0.44% was recorded that day;
On Tuesday, the index opened flat and fluctuated slightly around 6690 points after the opening; in the second half, the index fell rapidly, then fluctuated slightly at a low level until the close, with no significant change in trading volume. A small bearish candlestick with a decline of 0.55% was recorded that day, closing above the 5-day moving average;
On Wednesday, the index opened slightly higher and continued to fluctuate. After about two hours, there was a rapid decline, followed by a rebound at the close. A small bearish candlestick with a decline of 0.28% was recorded that day, closing below the 5-day moving average;
On Thursday, the index opened lower and moved down, followed by a slight rebound; in the second half, due to market news, the index experienced a rapid decline. When it fell to the lower boundary of the channel, it found support, hitting the week's low of 6569.22 points, then rebounded quickly. A bearish "doji" K-line with a decline of 0.50% was recorded that day, closing below the 10-day moving average;
On Friday, the index opened slightly higher and fluctuated upward. Although there were ups and downs during the session, the amplitude was not large. A small bullish candlestick with a gain of 0.59% was recorded that day, and the index returned above the 10-day moving average.
This week, the index found support at the lower boundary of the channel for the sixth time, once again confirming the important support role of the channel's lower boundary.
Next, I will analyze the current changes in the index based on multiple model technical indicators.
(I) Quantitative Model Signal Analysis:
1. Weekly perspective (see Figure 1):
① Momentum Quantitative Model: The high-level stagnation signal has disappeared, indicating that a weekly-level momentum bearish divergence will not form in the near future. Currently, the two momentum lines are slowly rising, and the volume (red) bar has decreased compared to last week.
Model indicates downside risk index: Neutral
② Sentiment Quantitative Model: Sentiment 1 indicator strength is about 4.74 (range 0~10), sentiment 2 strength is about 4.97, and the peak signal indicator is 11.90. Model data indicates that after this week's violent fluctuations, the bullish sentiment has eased.
Model indicates volatility risk index: High
③ Digital Monitoring Model: No signals this week.
2. Daily perspective (see Figure 2):
① Momentum Quantitative Model: After Thursday's close, a momentum bearish divergence signal was issued, with the two momentum lines forming a death cross at a high level, and the volume bar turning from red to green.
Model indicates daily-level momentum bearish divergence has formed, downside risk index: High
② Sentiment Quantitative Model: After Friday's close, both sentiment indicators were at 0, the peak signal indicator was 5.63, and the index began to fall out of the high-risk zone and gradually decline.
Model indicates downside risk index: High
③ Digital Monitoring Model: After Monday's close, the monitoring signal was "D" (signal range A~E), and the numbers did not change in the following days, indicating that a daily-level top turning point signal was issued on Monday.
Model indicates downside risk index: High
(II) Trend Sequence and Historical Data Backtest Analysis (Figure 3):
1. My backtest model:
① Backtest data range: March 6, 2009 to April 4, 2025, totaling 840 weekly K-lines.
② Adjustment rules: Pullback ≤ 2 weeks and decline ≥ 5%, or pullback ≥ 3 weeks. There were 52 adjustments in the backtest data that met the criteria.
2. Statistical analysis of historical data to find patterns: Whenever the index rises for 25 consecutive weeks from a low point, the probability of an adjustment is greater than 96%.
3. In my backtest model, the longest upward cycle occurred from July 19, 2017 to January 26, 2018, when the index rose for 29 consecutive weeks, followed by a 13.43% decline; there were also two instances of significant adjustments after 26 consecutive weeks of gains.
4. From April 7 to September 26, the index has risen for 25 consecutive weeks.
II. Next Week's Market Forecast: (09.29~10.03)
1. At the daily level, two models have issued momentum bearish divergence and top turning point signals, and the historical data backtest model shows that after 25 consecutive weeks of gains, the probability of an adjustment is greater than 96%. Multiple sets of data are resonating, so I remind investors to be alert to the risk of a decline in the index.
2. The index found support near the lower boundary of the channel on Thursday. Next week, it is necessary to observe the effectiveness of this support.
3. The upward resistance is near the upper boundary of the channel; the first support below is near the lower boundary of the channel, the second support is around 6300 to 6340 points, and the key support is in the 6200 to 6147 points area.
III. Next Week's Trading Strategy: (09.29~10.03)
1. Total position: Long positions at 70%; if the index falls below the lifeline channel, reduce the position to below 30%.
2. For short-term investors, about 20% of the position can be used to make "short-term trades" based on support and resistance levels.
3. For short-term operations, it is recommended to switch the analysis cycle to a small cycle of 60 minutes or 120 minutes to obtain more accurate entry and exit points.
4. Individual stock trading can also refer to the above trading strategies.
IV. Special Reminder:
For individual stock swing trading, whether buying long or short positions, set an initial stop-loss immediately after opening a position. When the stock price gains 5%, immediately move the stop-loss to the cost line (i.e., the breakeven point) to ensure that the trade will not lose money; when the profit reaches 10%, raise the stop-loss to the 5% profit position. Thereafter, every time the profit increases by 5%, the stop-loss is raised by the same amount to dynamically protect realized profits (regarding the 5% profit setting, investors can decide for themselves).
IV. Classic Case Analysis: (For case analysis only, not investment advice)
1. Weibo (stock code_WB): (Long position)
Weibo (WB) Daily Chart:
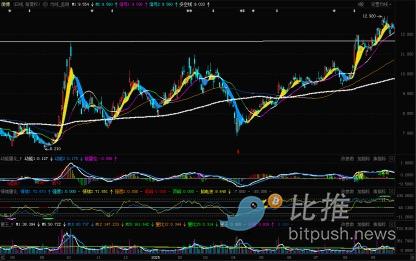
1. Buy conditions (long position): Buy price is $11.50~$12.00, initial stop-loss is $10.80, first target is $14.5~$15, swing trading.
2. From the weekly chart, since September 2023, this stock has been oscillating in a box between $6.2 and $11.58 for about two years. At the beginning of this month, the stock price broke through the upper edge of the box with increased volume. If it pulls back to the upper edge of the box with reduced volume and does not break, a long position can be taken.
3. This week, the stock opened at $12.33, the highest price was $12.58, the lowest was $11.94, and the closing price was $12.33. The weekly candlestick chart showed a bearish "doji" K-line with a decline of 1.60%. On Tuesday, the stock price adjusted to around $11.94 and rebounded, triggering the buy point I provided; on Wednesday, the stock price fluctuated and rose, with a maximum increase of about 4.5%; in the following two days, it pulled back after rising, and on Friday, a "T-shaped" K-line indicating a rebound after probing the bottom was recorded. Hold the stock and wait for a rise next week. (If the stock price gains more than 5% next week, I will raise the stop-loss to around $12)
As market news changes rapidly, I will adjust trading strategies and suggestions in a timely manner. Investors who want to get the latest information, please follow the link below.
Author: Cody Feng
Disclaimer: The content of this article solely reflects the author's opinion and does not represent the platform in any capacity. This article is not intended to serve as a reference for making investment decisions.
You may also like
Telegram, the world's largest social platform, launches major update: Your graphics card can now mine TON
Telegram’s ambition for privacy-focused AI

A well-known crypto KOL is embroiled in a "fraudulent donation scandal," accused of forging Hong Kong fire donation receipts, sparking a public outcry.
Using charity for false publicity is not unprecedented in the history of public figures.

An overview of two new projects in the Polkadot ecosystem and what they will bring to Polkadot Hub

HIC: Continue to bring truly valuable new projects to Polkadot in a sluggish market!