The token is testing a key support zone that aligns with multiple technical confluences, hinting that the selling pressure may be easing.
Large holders have been actively accumulating BONK , reportedly purchasing around 80 billion tokens, which adds further strength to the market’s bullish potential.
Price Analysis: Double Bottom, Symmetrical Triangle, and Upside Potential
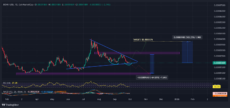
On the daily chart, BONK/USD is consolidating within a symmetrical triangle, a formation that often precedes a breakout.
Also, another notable development is the formation of a double-bottom pattern near the support zone, a classic reversal signal indicating potential exhaustion of selling pressure.
Currently trading around $0.00001889, BONK is positioned near the triangle’s apex. If the double-bottom pattern plays out and the price breaks above the descending resistance line, bullish targets come into focus, with a key level around $0.0000376, representing a potential 100%+ upside.

Source: TradingView
The Relative Strength Index (RSI) sits at 37.35, signaling oversold conditions and supporting the likelihood of a rebound. While the MACD has not yet produced a bullish crossover, signs of convergence could favor upward momentum if confirmed.
On the other hand, a breakdown below the ascending support trendline would invalidate the bullish setup, opening the door to a potential decline toward $0.00000696, a level that coincides with previous demand zones. This would mark a significant drop of over 64%.
100% Rally Incoming?
BONK is at an important moment. The combination of a symmetrical triangle, double-bottom formation, and oversold indicators suggests a potential breakout.
Traders should monitor volume spikes and resistance breakouts carefully, as a confirmed move could set the stage for a massive 100%+ rally.


