Bitcoin bullish flag is a corrective descending channel that often precedes breakouts; current formations and on‑chain buyer dominance point to a potential move toward $140,000, with Fibonacci extensions near $142k–$166k and October–November viewed as probable breakout months.
-
Bullish flag suggests $140K target with higher Fibonacci extensions near $142,831 and $166,546.
-
On‑chain Spot Taker CVD flipped positive after mid‑July, indicating buyer dominance.
-
October and November historically show seasonal strength; current liquidity metrics back elevated breakout odds.
Bitcoin bullish flag signals a move toward $140K; on‑chain buying, Fibonacci targets, and seasonal liquidity support October–November breakout odds — read key takeaways and analysis.
Bitcoin forms a bullish flag with analysts targeting $140K, supported by Fibonacci levels, strong liquidity, and seasonal rally patterns.
- Bitcoin forms a bullish flag, with analysts eyeing $140K and Fibonacci targets near $166K.
- On-chain data shows buyer dominance as Spot Taker CVD flips positive after mid-July.
- October and November are viewed as breakout months, backed by seasonal strength and liquidity.
Bitcoin is showing chart structures that align with another bullish rally. Current technical formations reveal a bullish flag pattern, and analysts point to October and November as potential catalysts for stronger upward momentum. Market participants are tracking key levels while historical data supports seasonal strength in this period.
What does the bullish flag formation mean for Bitcoin price targets?
Bitcoin has moved inside a descending channel since August 2023, forming a corrective flag that often precedes continuation. Analysts project an initial target near $140,000 with extended Fibonacci projections up to $166,546 if resistance breaks decisively.
Captain Faibik’s charting highlights consistency with prior consolidations that preceded major rallies. Support and resistance within the channel continue to dictate near‑term price action and risk management levels.
$BTC is getting Ready for Another Bullish Rally..🚀
I think October & November are gonna be Bullish Months..📈
Before the Breakout, if we get a dip, that would be a very good Opportunity.. 😉 #Crypto #Bitcoin #BTCUSD pic.twitter.com/Kt3UTl1VLv
— Captain Faibik 🐺 (Twitter) October 1, 2025
Technical projections indicate that once resistance breaks, price expansion could target the $140,000 level. Earlier in 2023, Bitcoin exited a similar descending channel and delivered a sharp upward continuation. The repeating behavior signals alignment with a continuation pattern that has appeared across multiple market cycles.
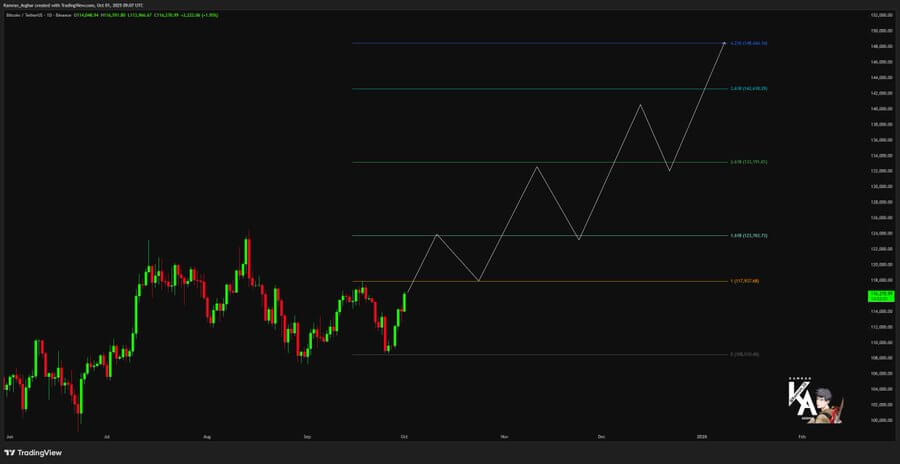 Source: KamranAsghar (X)
Kamran Asghar also mapped Fibonacci extension targets that reinforce these levels. His analysis showed resistance near $127,568, extending toward $142,831 and $166,546. This sequence reflects progressively higher projections, supported by the ongoing formation of higher highs and higher lows in the daily chart.
How do liquidity and seasonal patterns support a breakout?
Bitcoin is currently trading at $116,702, recording a 3.16 percent increase in 24 hours, according to CoinMarketCap data. Daily trading volume stood at $62.75 billion, with circulating supply at 19.92 million BTC and market capitalization near $2.32 trillion — metrics that point to strong liquidity.
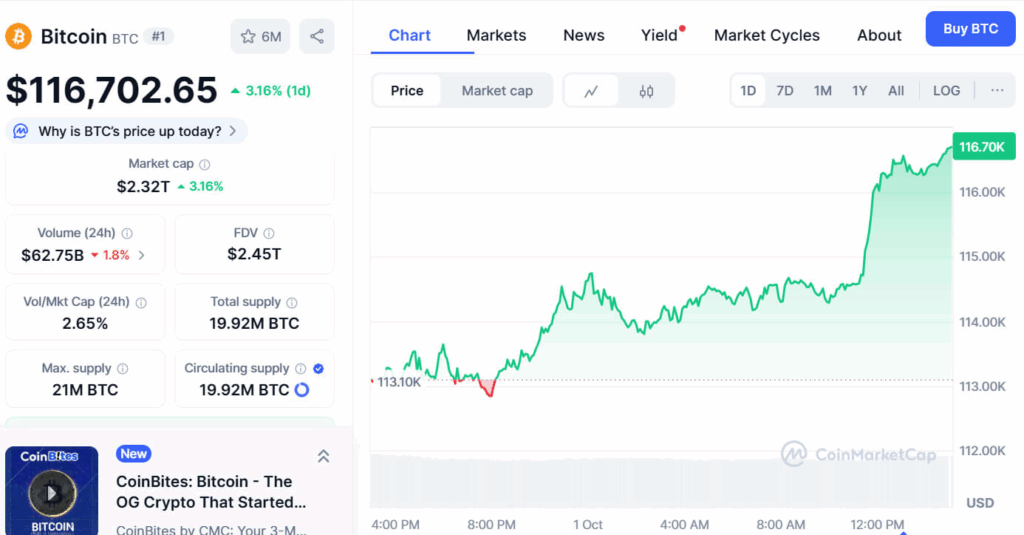 Source: CoinMarketCap
On‑chain indicators show steady accumulation across exchanges, with the Spot Taker CVD flipping positive since mid‑July. This metric captures the balance between aggressive buying and selling; the current positive trend confirms buyer dominance. At the same time, the Coinbase premium index indicates persistent spot demand from U.S. investors.
Historical seasonality also matters: when Bitcoin ends September positively, subsequent multi‑month rallies are more common. October — often called “Uptober” — has averaged gains exceeding 20 percent in multiple years. With the flag intact and seasonal momentum approaching, analysts assign higher odds to breakouts in October and November.
Frequently Asked Questions
What entry and stop levels do analysts recommend for a flag breakout?
Traders commonly enter on a confirmed daily close above channel resistance with stop losses below the recent flag low. Initial profit targets use the flagpole height, then Fibonacci extensions for extended targets such as $142k and $166k.
How reliable is Spot Taker CVD for confirming breakouts?
Spot Taker CVD is a directional liquidity indicator; a sustained positive flip suggests net buying pressure and improves breakout reliability when combined with price and volume confirmation.
Key Takeaways
- Bullish flag identified: A descending channel since August reads as a continuation pattern with a $140K initial target.
- On‑chain confirmation: Spot Taker CVD flipping positive signals buyer dominance supporting sustainable moves.
- Seasonal and liquidity edge: Strong trading volume and historical October–November strength increase breakout probability; use progressive Fibonacci targets and risk management.
Conclusion
This analysis finds that the Bitcoin bullish flag, reinforced by Fibonacci projections and positive on‑chain indicators, supports a plausible path toward $140,000 and higher extensions. Traders should combine technical breakout confirmation with on‑chain signals and seasonal context, and monitor liquidity and volume for sustained moves.