Pi Coin Price Faces 30% Crash Risk As Bearish Patterns Clash With A Key Support

The Pi Coin price is stuck near $0.26 with sellers gaining ground. One key support could decide whether the coin holds steady or slides nearly 30%.
Pi Coin investors may be hoping for an October rebound, but the charts suggest otherwise. After slipping nearly 24% month-on-month, the Pi Coin price is still stuck near $0.26.
Flat trading over the past week shows little strength, leaving one key support between stability and another sharp correction.
Market Chatter Fades, Hinting At Weakness
Pi Coin is starting October with less attention from traders. Mentions across the market, what analysts call social dominance, have dropped from 0.234% on September 26 to just 0.07% by October 3.
While not the lowest of the month, yet, it is close to late-September levels that marked turning points before sharp declines.
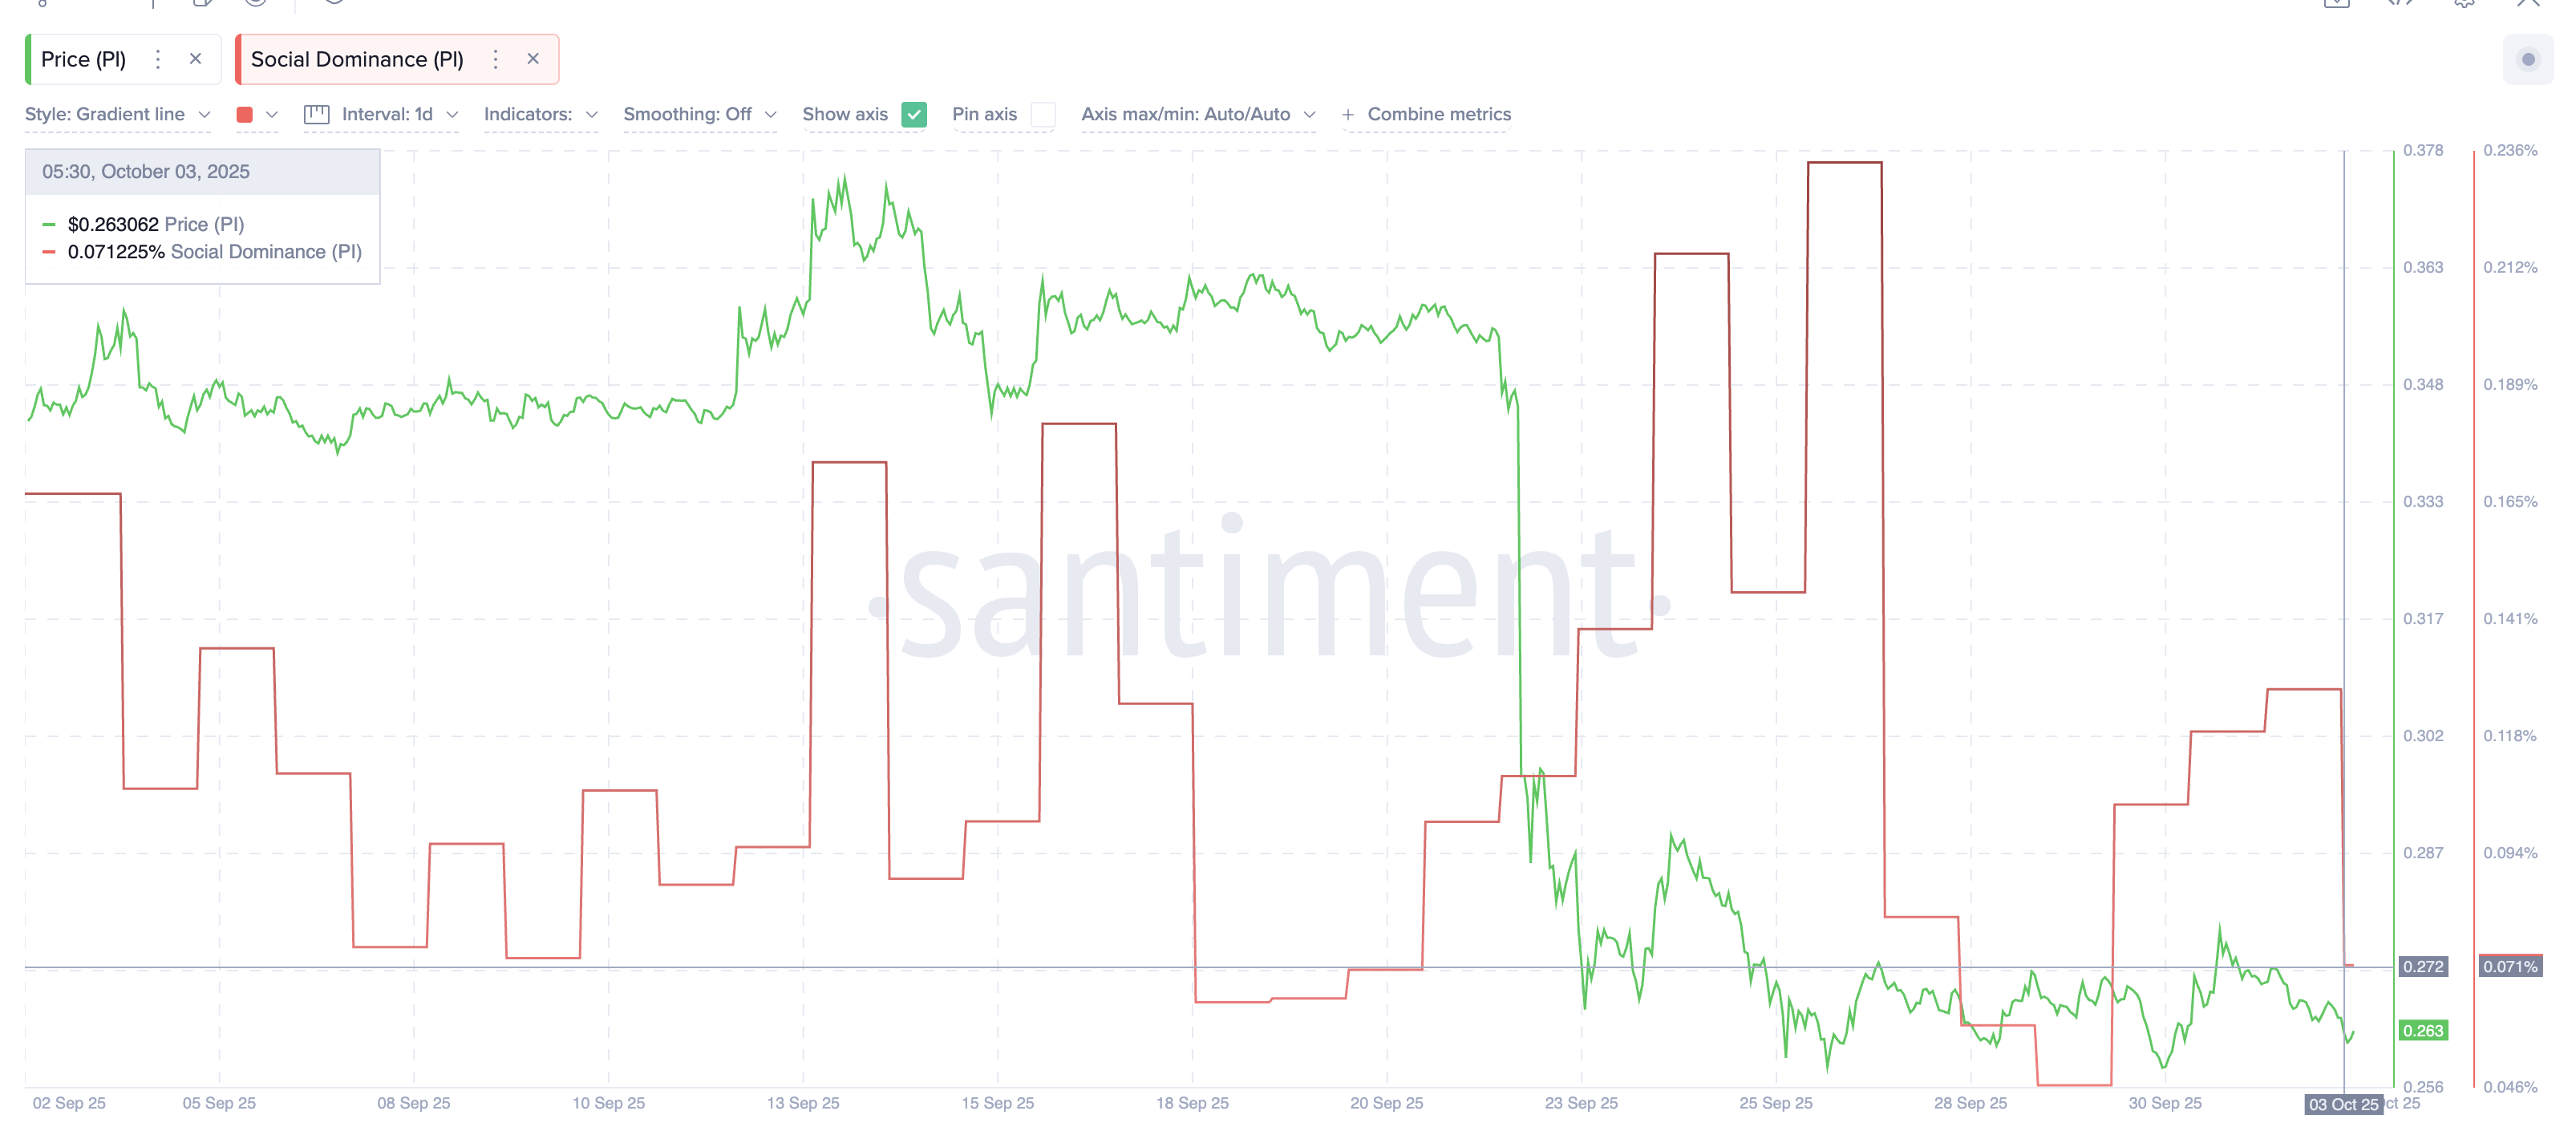 Pi Coin Price And Social Dominance:
This pattern has played out before. When dominance hit a local low on September 19, the Pi Coin price tumbled from $0.36 to $0.26 within days. A similar reaction followed the September 14 dip. With chatter drying up again, the coin looks exposed to another round of selling pressure.
Want more token insights like this? Sign up for Editor Harsh Notariya’s Daily Crypto Newsletter .
Volume Signals Echo The Same Story
Quiet markets usually show up in trading volume as well, and Pi Coin is no exception. Recent activity is flashing yellow on Wyckoff volume — a form of volume spread analysis that highlights whether buyers or sellers are slowly taking control.
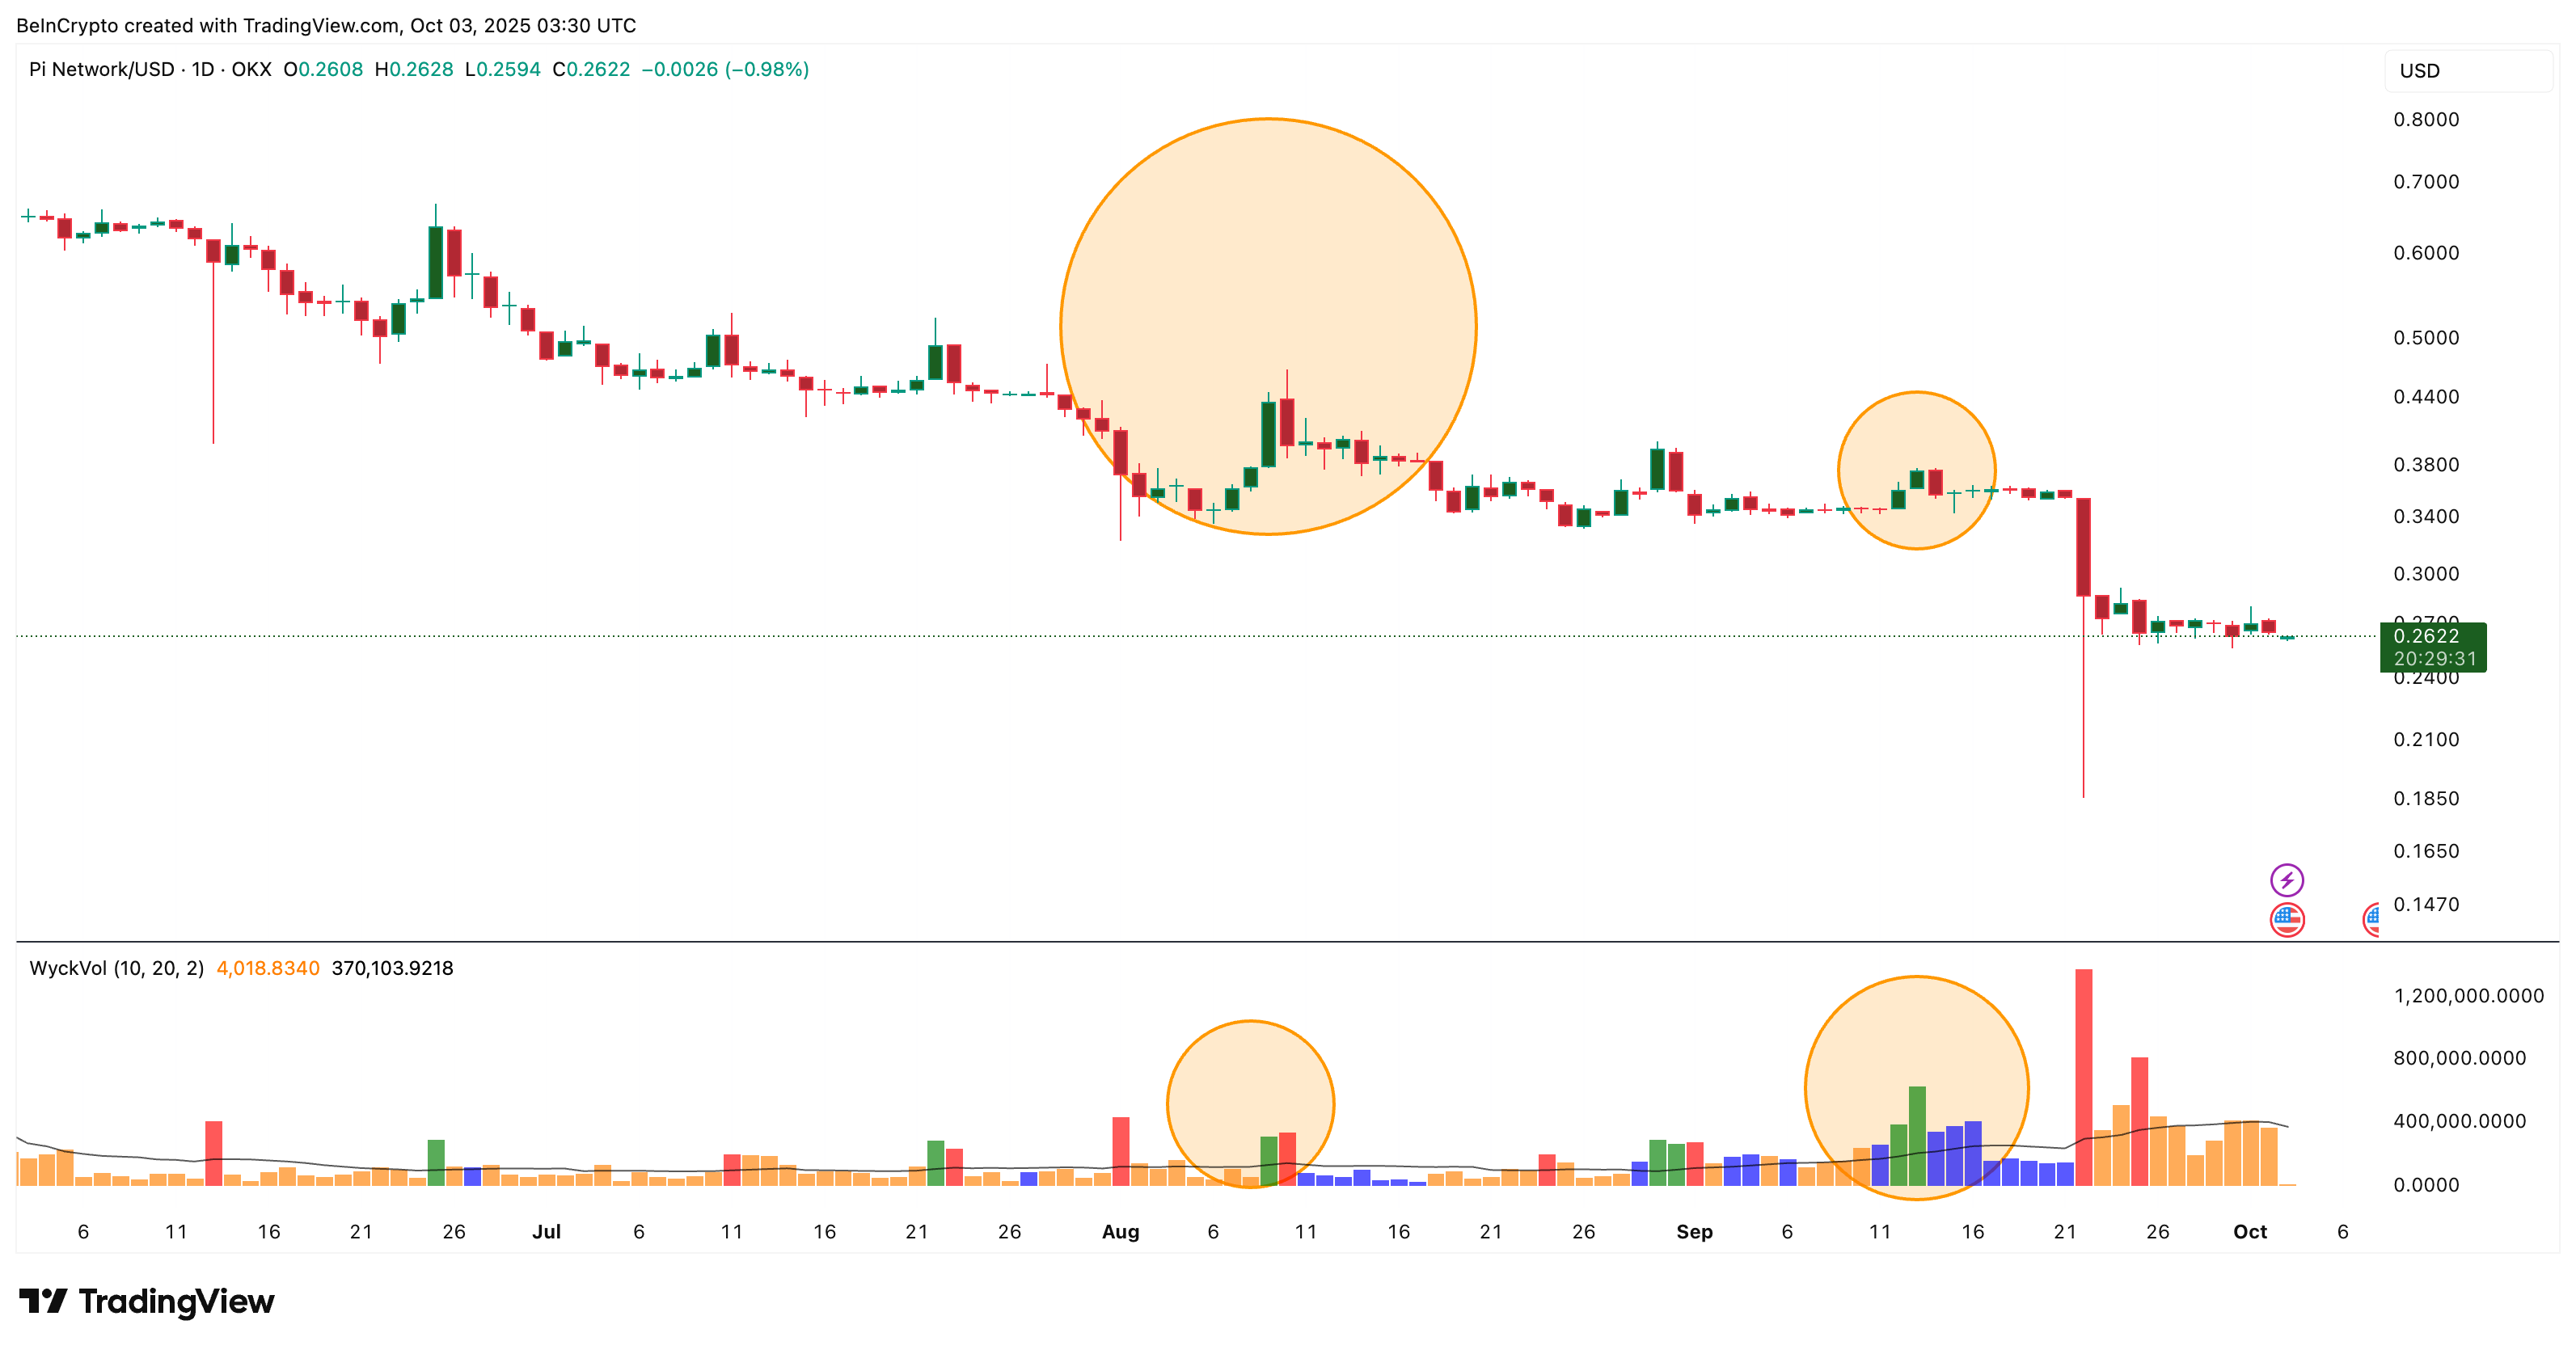 Pi Coin Price And Volume:
In past rallies, the bars shifted into blue or green, showing buyers were regaining strength. Extended yellow or red phases, however, have almost always lined up with deeper corrections.
Right now, the yellow bars confirm what social dominance already suggests: buyers are losing ground, and sellers are starting to press harder. Unless volume flips back to stronger buyer signals (blue to green shift), the Pi Coin price will likely stay weak.
Pi Coin Price At Make-Or-Break Support
The 12-hour chart ties these signals together. Pi Coin is moving inside a descending triangle, a bearish setup where price keeps making lower highs while testing the same support. Momentum isn’t helping either.
The Relative Strength Index (RSI), which tracks buying and selling strength, has inched higher while the price has made lower highs. This mismatch shows that even when momentum tries to recover, sellers remain in control.
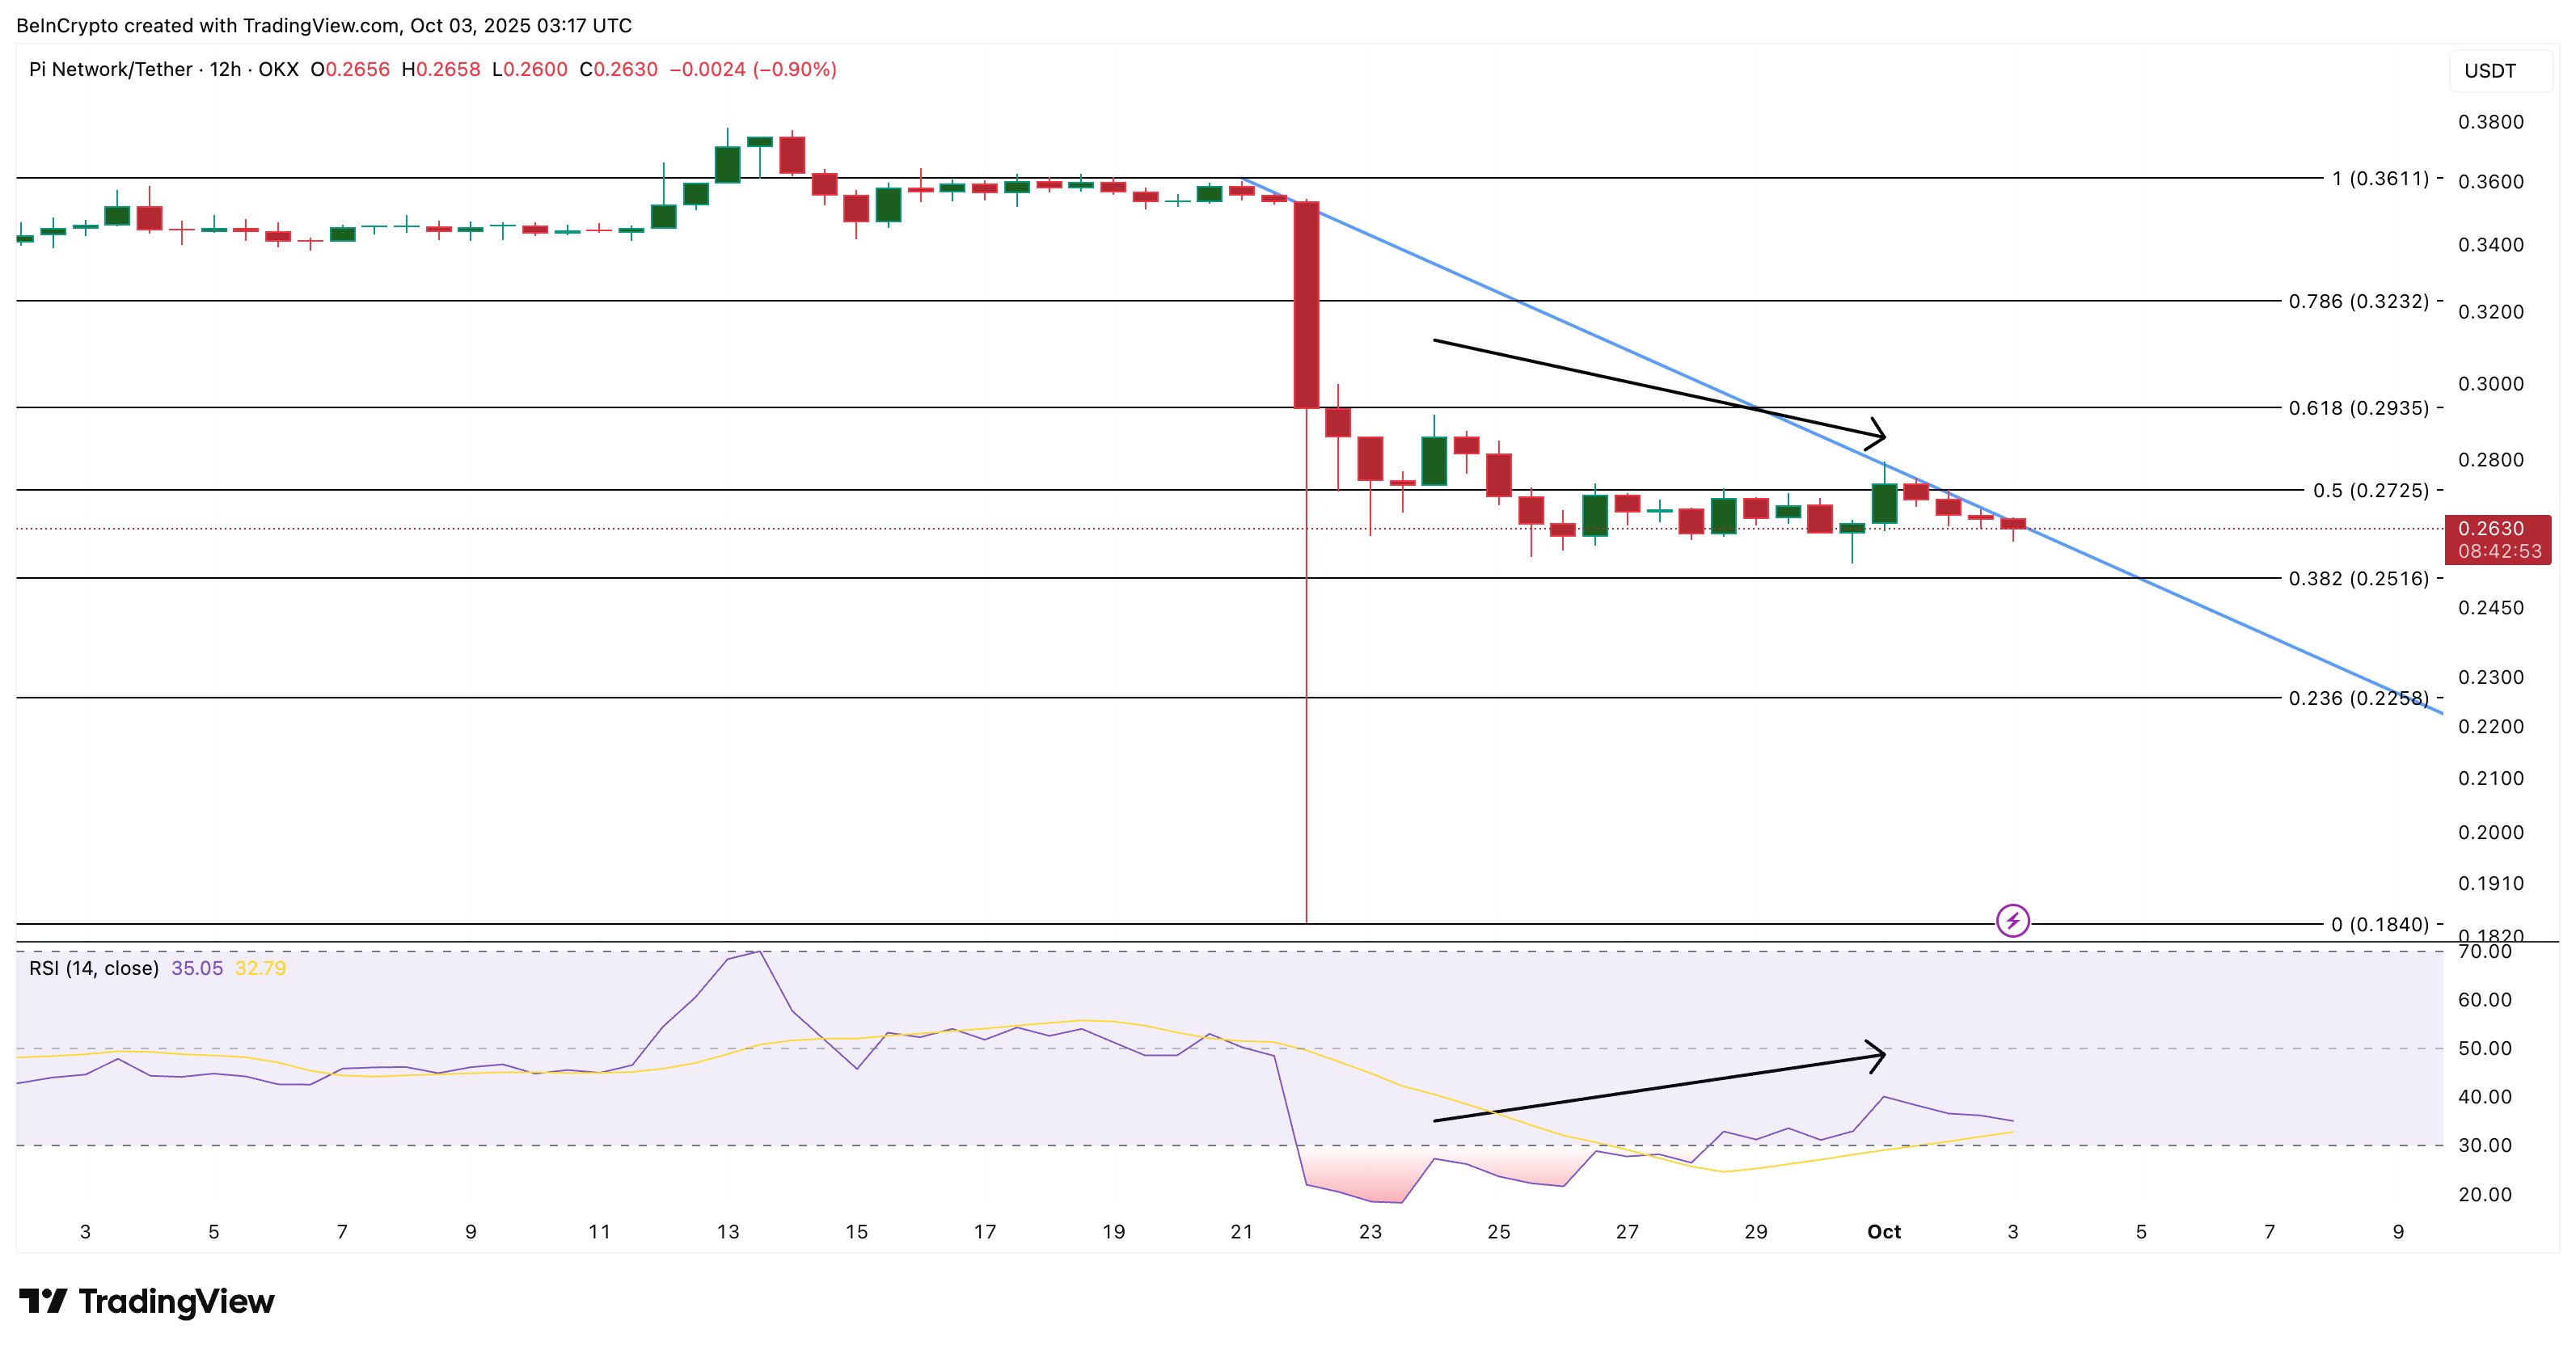 Pi Coin Price Analysis:
If $0.25 breaks, the price could quickly slide to $0.22 and then $0.18, a drop of nearly 30%. For buyers, the key invalidation is reclaiming $0.27. That could open a short bounce to $0.29 and $0.32.
For now, fading chatter, seller-tilted volume, and a bearish chart pattern all point the same way: unless $0.25 holds (the key support), the Pi Coin price risks another sharp leg down.
Disclaimer: The content of this article solely reflects the author's opinion and does not represent the platform in any capacity. This article is not intended to serve as a reference for making investment decisions.
You may also like
Crypto Markets Face a Rollercoaster: What Happened in the Past 24 Hours?
In Brief Bitcoin price dropped by 2.4%, influencing overall crypto market sentiment. The top 10 cryptocurrencies saw a general decline over the past 24 hours. Market seeks stability amid cautious investor behavior and potential short-term volatility.