The token jumped from $0.000009138 during the rally, briefly touching resistance at $0.000009681 before consolidating near $0.000009600, as per CoinMarketCap data .
Volume Surge and Whale Activity
Daily trading volume spiked to 5.61 trillion tokens, nearly triple the 30-day average of 1.89 trillion. According to Nansen , this surge followed heavy whale accumulation, with the top 100 non-exchange Ethereum addresses adding 3.4% to their PEPE holdings over the past month.
Meanwhile, exchange wallets saw a 2% decline in balances, hinting that coins are moving into long-term storage.
This shift reflects growing confidence from larger investors, with open interest in PEPE futures climbing toward $639 million as per CoinGlass data .
PEPE Price Analysis: Symmetrical Triangle Near Breakout
The weekly chart shows PEPE consolidating within a symmetrical triangle pattern. Price has been squeezed tightly between lower highs and higher lows, setting the stage for a decisive move.
A breakout above resistance at $0.000009681 could trigger a run toward the $0.00002500–$0.00003000 zone.
A measured move projection from the triangle points to a potential rally as high as $0.00004061, representing over 400% upside.
However, a failure to hold support around $0.00000900 risks a breakdown, with potential downside toward lower support levels.
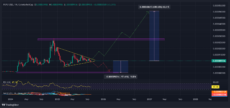
Source: TradingView
Meanwhile, currently at 47.16, the RSI is suggesting neutral momentum with room for either a bullish breakout or a bearish reversal. Also, the MACD is flattening near zero, showing that momentum is coiling but not yet committed in either direction.
With whales accumulating, volumes surging, and technical patterns nearing completion, PEPE is at a crossroads.