Date: Sat, Oct 04, 2025 | 10:58 AM GMT
The cryptocurrency market is showing strength as the prices of both Bitcoin (BTC) and Ethereum (ETH) have surged over 11% in the past 7 days. Riding this resilience, several altcoins are starting to flash bullish signals — and Sonic (S) is one of them.
S is up 17% this week, but what makes it more interesting is its technical structure, which appears to be gearing up for a potential bullish breakout in the near term.
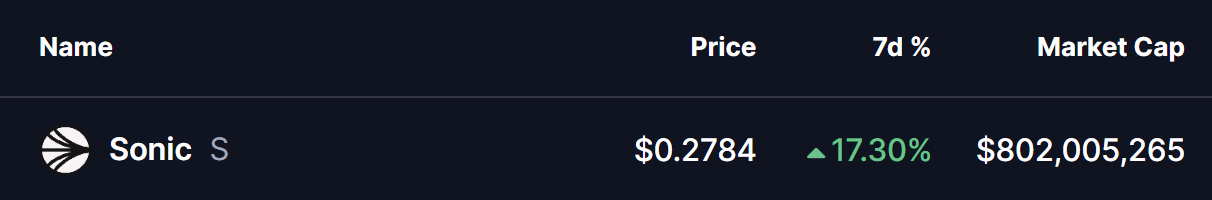 Source: Coinmarketcap
Falling Wedge in Play
On the daily chart, as highlighted by crypto analyst Jonathan, S is carving out a falling wedge pattern — a setup often viewed as a bullish reversal structure that tends to emerge at the tail end of prolonged downtrends.
During the recent correction, S slipped toward $0.2219 after facing resistance at the wedge’s upper boundary. Buyers, however, stepped in and defended this level, sparking a rebound that has now pushed the token near $0.2787, where it is currently testing the wedge resistance trendline.
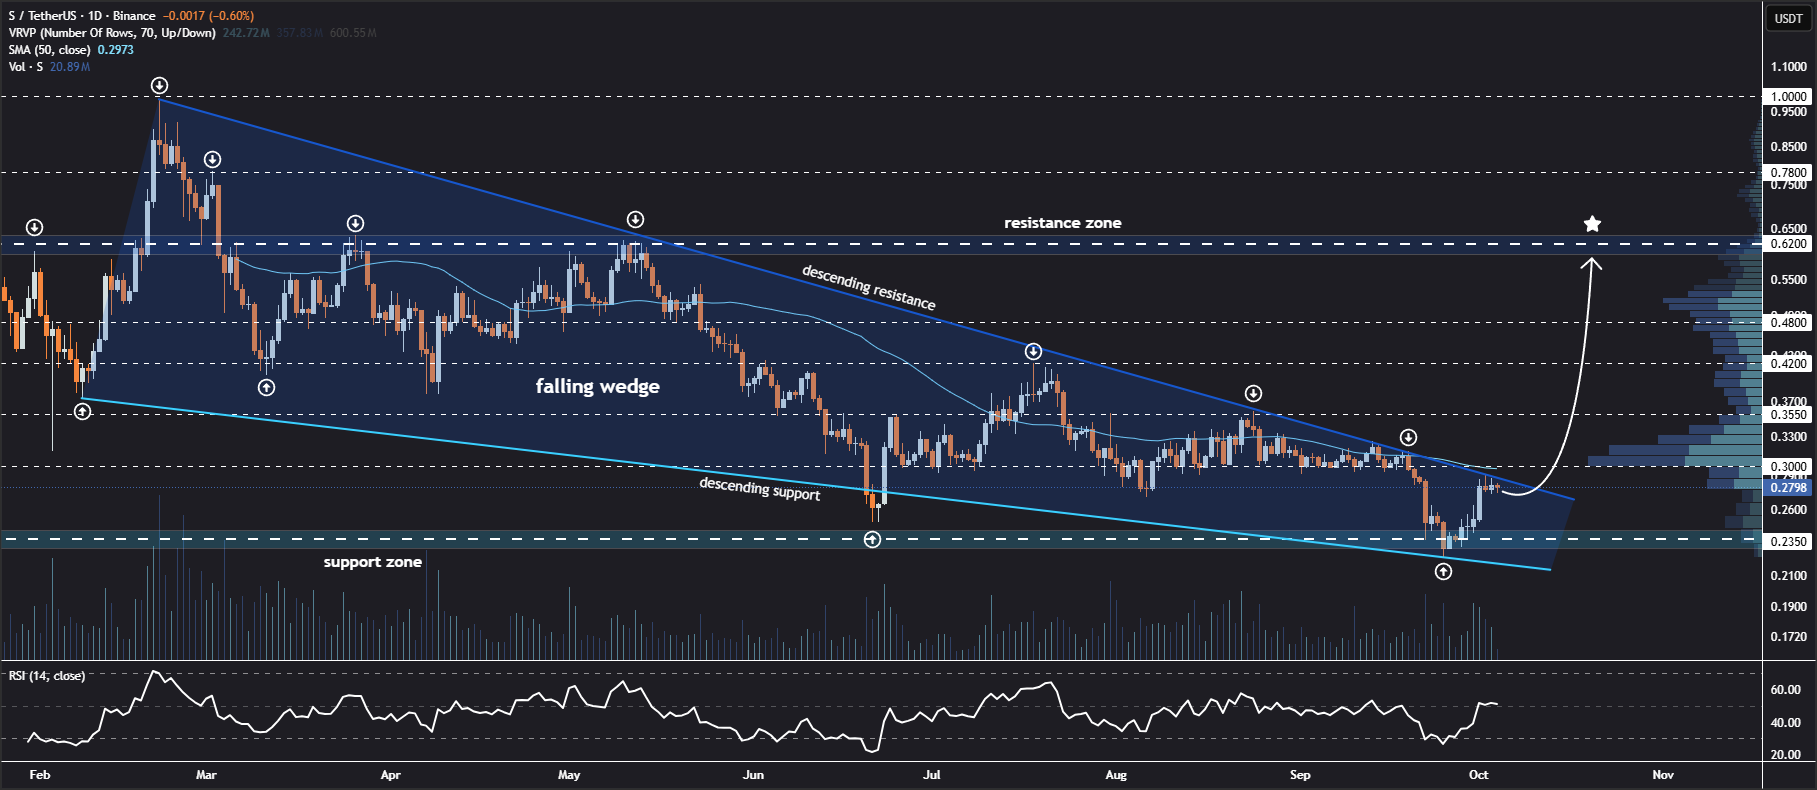 Sonic (S) Daily Chart/Credits: @JohncyCrypto (X)
The tightening wedge indicates that momentum is building, with a decisive move likely on the horizon.
What’s Next for S?
If bulls manage to push S above the wedge resistance and reclaim the 50-day moving average (MA) at $0.2973, it would likely confirm a bullish breakout. A successful move could set the stage for a rally toward price targets of $0.300 → $0.355 → $0.420 → $0.480 → $0.620 in the medium term.
On the other hand, if the breakout attempt fails, the token could once again retest its wedge support before making another push higher.
For now, the setup suggests that Sonic (S) is at a critical juncture — either preparing for a bullish breakout or heading for one last test of its lower support levels.