Ethereum whale sell-off: a major holder sold 45,000 ETH (~$208M), increasing short-term downside risk for ETH price. The move pressured price below $4,860 resistance and put $4,430 support at risk, pointing to a possible 10–12% corrective pullback if support fails.
-
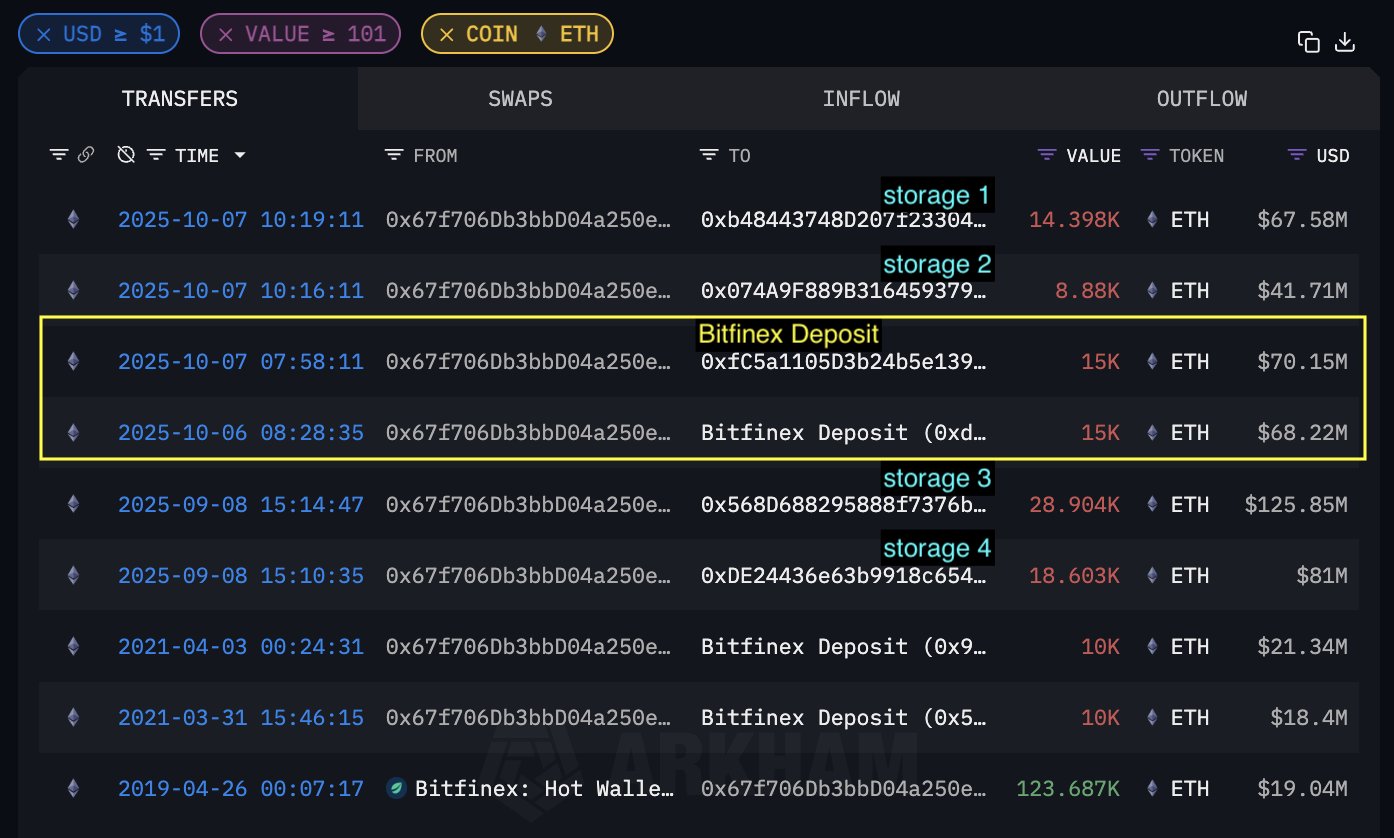
Whale sold 45,000 ETH across exchanges and wallets, raising immediate sell pressure.
-
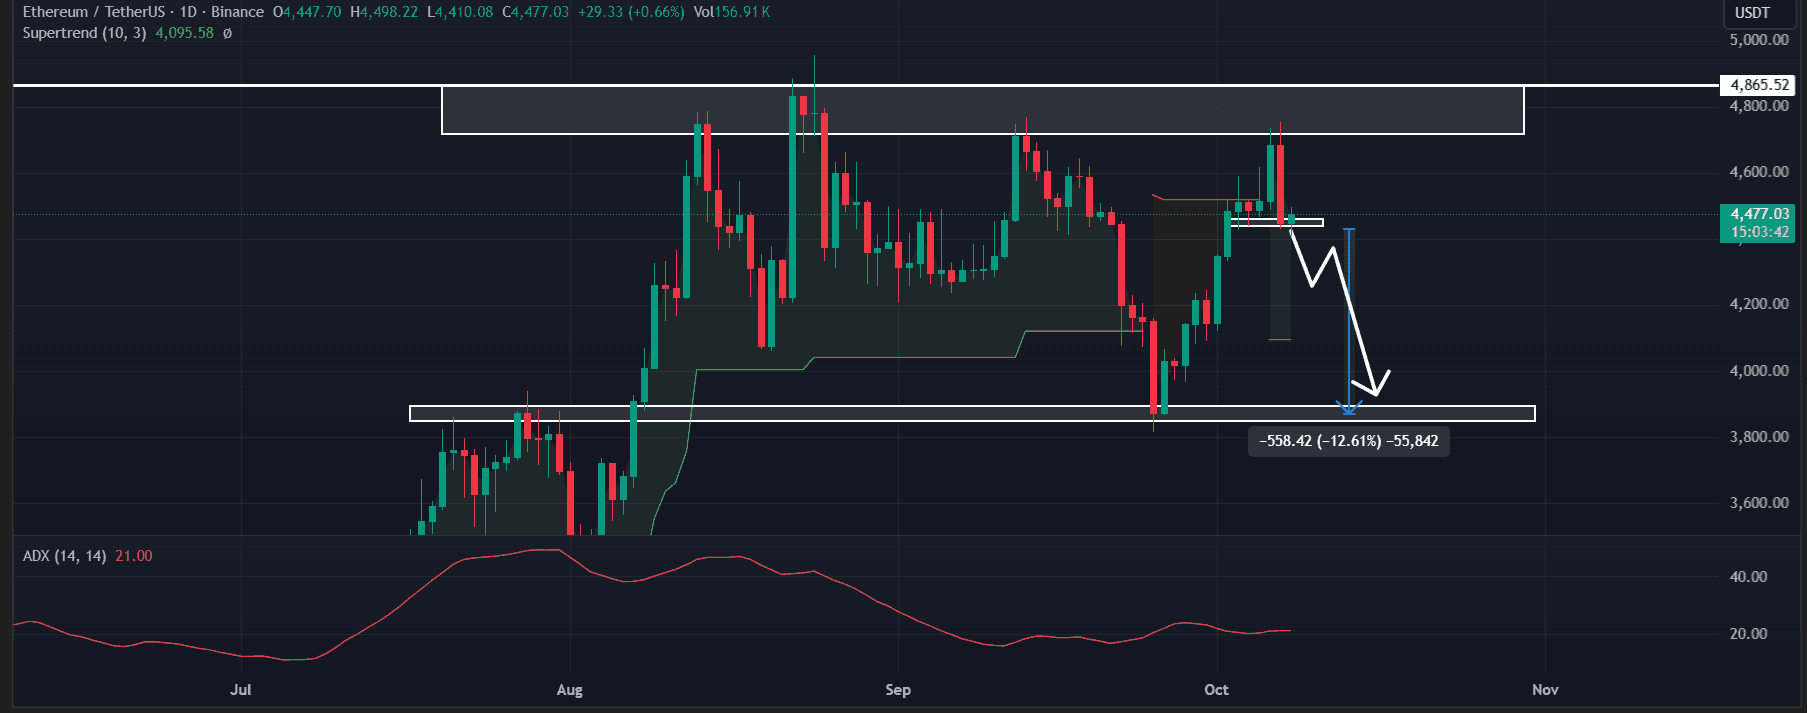
ETH faces critical support at $4,430; a break could target ~$3,860 (≈12% decline).
-
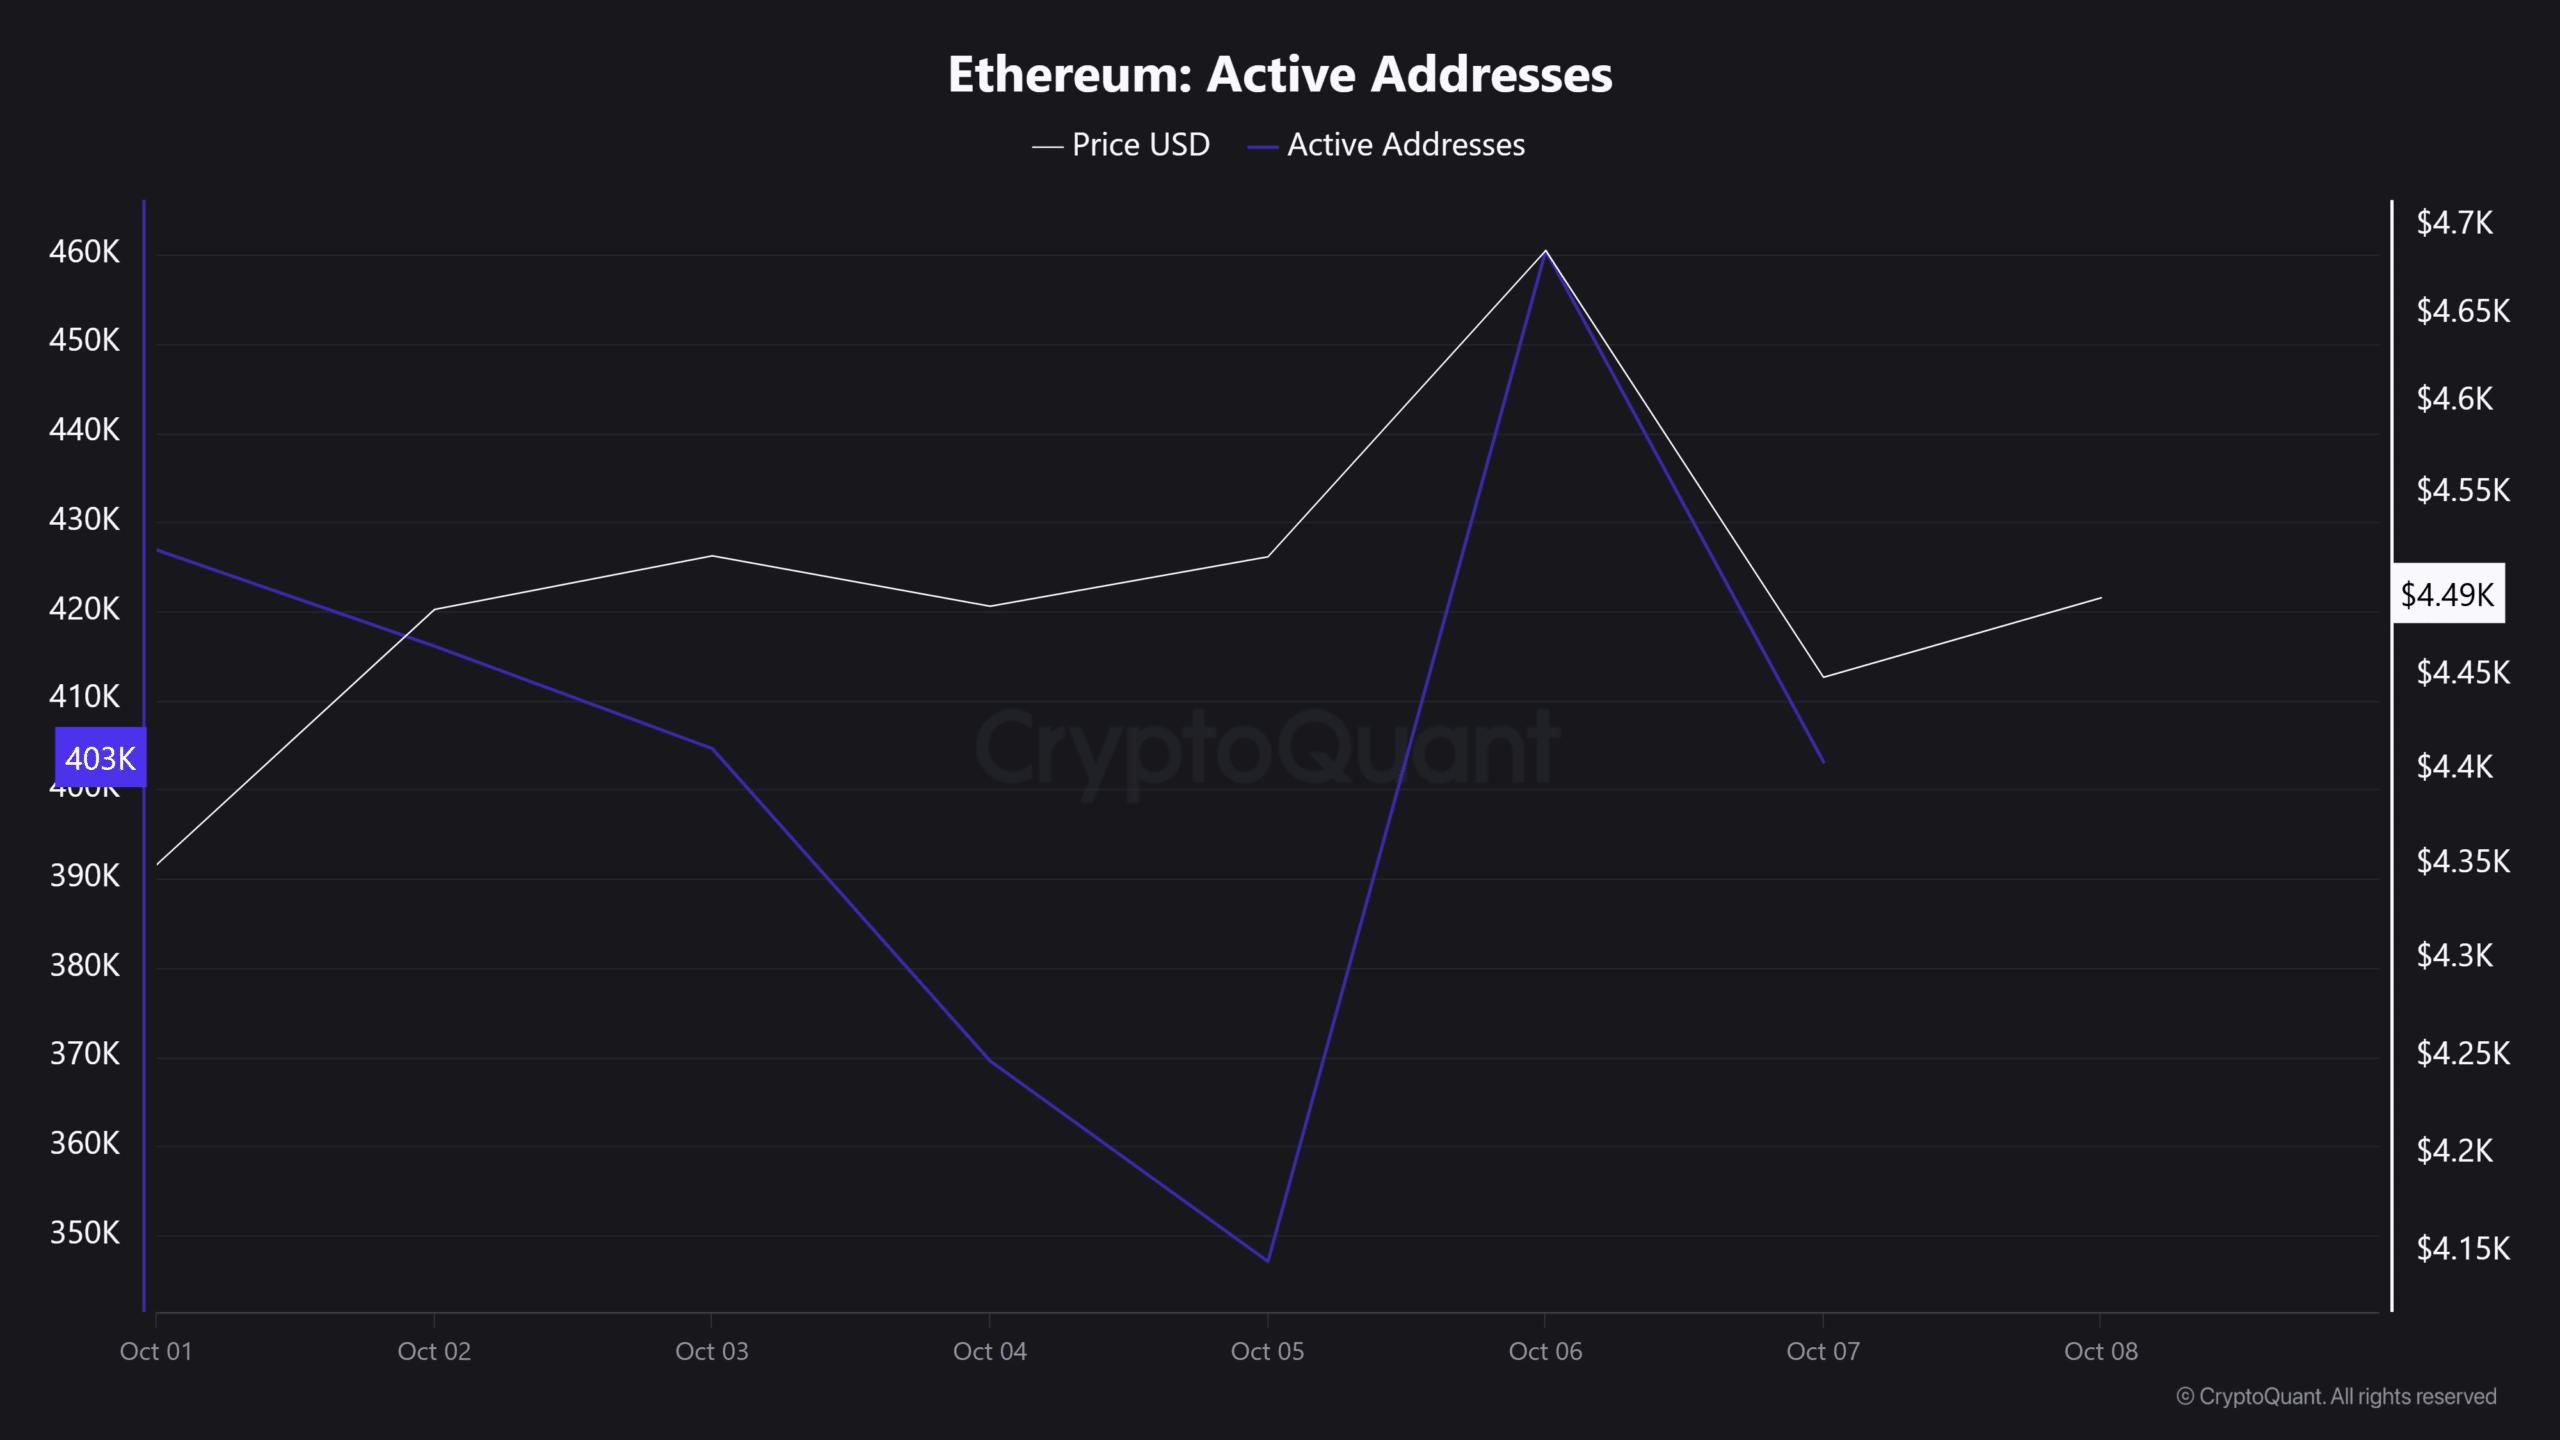
Active addresses fell ~12% in 24 hours; rising volume amid price drops signals stronger sell-side participation.
Ethereum whale sell-off spurs ETH price outlook uncertainty — learn support levels, on-chain data, and trader actions now.
What is the Ethereum whale sell-off and why does it matter?
Ethereum whale sell-off refers to a large holder liquidating tens of thousands of ETH, which increases supply on exchanges and can amplify short-term price declines. Large offloads raise market volatility, test key support levels, and often trigger liquidations that magnify downward moves.
How did the recent whale activity unfold?
A single large holder moved and sold a total of 45,000 ETH over recent days. SpotOnChain-style on-chain monitoring shows 15,000 ETH went to Bitfinex in one tranche and 30,000 ETH was sold earlier at an average price near $4,612. The whale still holds multiple wallets with roughly 70,785 ETH remaining.
What is the current ETH price outlook?
ETH price outlook depends on $4,430 support. If $4,430 holds, expect range-bound action or short relief bounces. If it fails, models show a potential ~12% correction toward $3,860. Market indicators provide mixed signals: ADX at ~21 suggests weak momentum, while Supertrend remains green, keeping the broader uptrend intact.
Which on-chain and market indicators matter now?
Key metrics to watch:
- Active Addresses: Ethereum active addresses fell from ~460,449 to ~403,093 in 24 hours, indicating reduced network engagement.
- Trading Volume: Volume rose ~26.6% during the drop, a sign of increased sell-side participation.
- Liquidation Map: Short- and long-liquidation clusters sit near $4,407 and $4,553, respectively, with substantial open positions noted.
How should traders respond to a whale-driven move?
1. Monitor $4,430 support closely and set clear stop-loss levels. 2. Watch on-chain active addresses and exchange inflows for continued selling. 3. Use position sizing and avoid chasing leverage near key liquidation zones.
Detailed report
Ethereum traders are recalibrating after a large holder sold 45,000 ETH—about $208 million at recent prices—across multiple transactions. SpotOnChain-style on-chain data indicates one 15,000-ETH tranche executed on Bitfinex, and another 30,000 ETH sold at an average near $4,612. Despite these sales, the whale maintains roughly 70,785 ETH across four wallets, worth hundreds of millions at current levels.
Price action: ETH pulled back from the $4,860 resistance zone and traded near $4,490 at the time of reporting, down roughly 4.7% in 24 hours. Trading volume rose materially to approximately $57.16 billion, suggesting stronger selling interest during the decline.
On technicals, a bearish engulfing candlestick formed near $4,860 resistance on the daily chart, signaling short-term seller dominance. Short-term support at $4,430 is pivotal; a confirmed break could see measured downside toward $3,860 (~12% lower). The ADX reading near 21 shows weak trend strength, meaning moves may be choppy and subject to quick reversals.
Why did network activity decline?
CryptoQuant-style metrics show active addresses falling from ~460,449 to ~403,093 in 24 hours. Reduced active addresses often indicate lower user engagement and can precede price weakness if sustained.
What experts and traders are saying
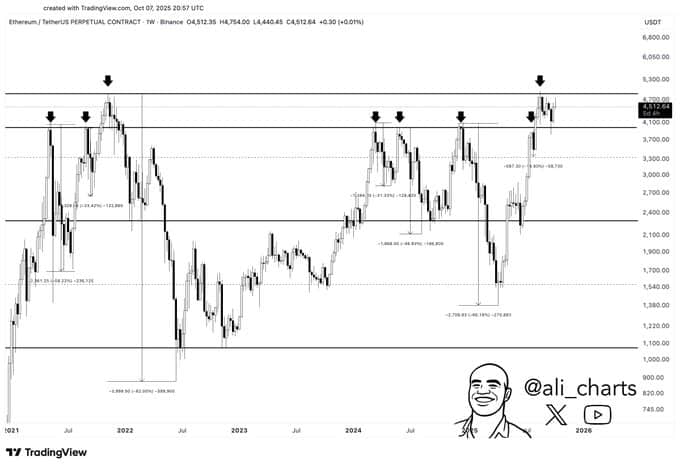
Analysts monitoring historical price action observe the $4,000–$4,800 band as a recurring “danger zone” for ETH corrections. Short interest has increased and open interest/liquidation clusters place additional downside pressure if price action triggers cascading stops.
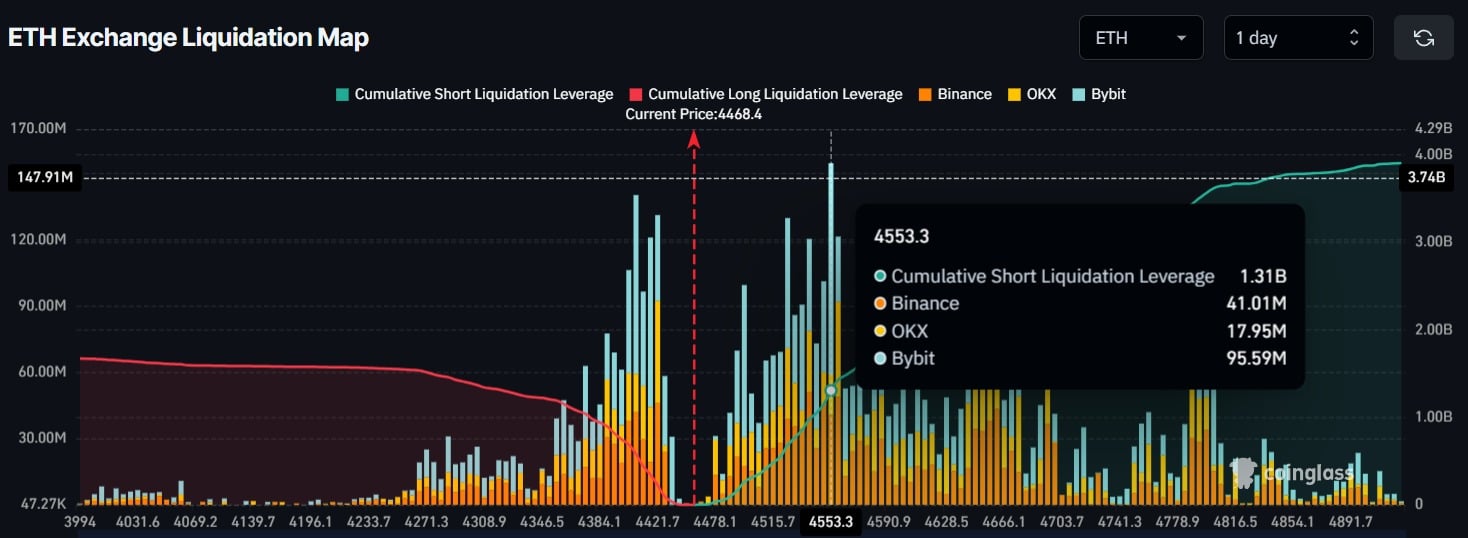
Reported liquidation clustering shows ~$581.3M in longs near lower thresholds and ~$1.31B in shorts around upper ranges, reflecting a tilted bearish bias and elevated market tension.
Frequently Asked Questions
How much ETH did the whale sell and where?
The whale sold a combined 45,000 ETH (~$208M) across recent transactions, including a 15,000-ETH tranche on Bitfinex and prior sales totaling 30,000 ETH. The seller still holds roughly 70,785 ETH across four wallets.
Is a 12% correction likely for ETH?
A ~12% correction toward $3,860 is a measured target if $4,430 support breaks. Technical setups and liquidation maps make this scenario plausible, though weak ADX suggests momentum may be limited.
Key Takeaways
- Major sell-off occurred: A whale moved and sold 45,000 ETH, increasing short-term selling pressure.
- Support to watch: $4,430 is pivotal; a breakdown may target ~$3,860 (~12% decline).
- Trader actions: Monitor active addresses, volume spikes, and liquidation clusters; use risk controls and position sizing.
Conclusion
Ethereum whale sell-off dynamics have pushed ETH into a critical technical zone. Short-term risk centers on $4,430 support, while on-chain indicators like active addresses and exchange inflows suggest increased vulnerability. Traders should track these levels and use disciplined risk management as the market digests large-holder behavior. Published: 2025-10-08. Updated: 2025-10-08. Author: COINOTAG.