
BNB News Today: BNB’s $1,100 Level Faces Test—Will It Spark a 30% Decline or a Strong Recovery?
- Binance Coin (BNB) faces a potential 30% drop as technical analysts identify a "double top" pattern near $1,350–$1,375 resistance. - A $21.75B outflow from Binance and a $20B liquidation event on October 10 highlight growing risks to market confidence. - While BNB remains above key support levels ($1,155/EMA20, $1,042/EMA50), bearish indicators like negative funding rates (-0.015%) signal ongoing pressure. - Binance's $283M compensation pledge and the "L1 wealth effect" cycle could drive rebounds, but su
Binance Coin (BNB) is facing downward pressure as chart analysts highlight the risk of a 30% pullback, citing a traditional "double top" pattern on its price chart. This formation, which often indicates a loss of upward momentum, appears as Binance's centralized exchange sees $21.75 billion in withdrawals and the platform faces increased attention following a recent margin system vulnerability.

The double top is characterized by two unsuccessful attempts to break above the $1,350–$1,375 resistance area, with crucial support at the neckline near $1,100. Should
Recent developments have intensified worries. On October 10, a mispricing by Binance's internal oracle led to widespread margin calls, resulting in $20 billion in liquidations. Experts like Dr. Martin Hiesboeck from Uphold believe this may have been a deliberate attack on Binance's Unified Account system, possibly causing losses up to $1 billion. Binance has responded by allocating $283 million in compensation for affected users, but confidence in the market remains shaken.
Despite these challenges, BNB's value is still holding above important support levels, including the 20-day exponential moving average (EMA) at $1,155 and the 50-day EMA at $1,042. A bounce from these points could negate the double top pattern, giving buyers another chance to challenge the $1,350 resistance. However, the ongoing trend of withdrawals—Binance's seven-day net outflow stands at $3.69 billion—indicates persistent uncertainty.
Traders are also watching the "L1 wealth effect," where rising BNB prices have attracted more capital into the BNB Chain ecosystem, similar to Solana's rally in 2024. While this internal capital rotation has supported short-term growth, analysts warn that the cycle could reverse if stablecoin reserves fall or funds leave the network.
Technical metrics offer a mixed outlook. BNB's RSI is currently at 56.31, suggesting neutral to slightly positive momentum, while the MACD's small bullish crossover points to continued buying interest. Yet, negative funding rates in the derivatives market—now at -0.015%—reflect increasing bearish sentiment among traders.
BNB's future trajectory depends on its ability to stay above $1,100. Holding this level could revive bullish momentum, with $1,416 as the next significant resistance. On the other hand, a breakdown may prompt a move toward the 50-day EMA at $730–$750, and if that support fails, further declines to $1,050–$1,100 are possible.
[9] BNB technical analysis - Daily Updates|Bitget (https://www.bitget.com/price/bnb/technical)
Disclaimer: The content of this article solely reflects the author's opinion and does not represent the platform in any capacity. This article is not intended to serve as a reference for making investment decisions.
You may also like
Bitcoin News Update: Tether's Risky Reserve Change: Exposure to Cryptocurrency and Gold Poses a Challenge to Stablecoin Stability
- Tether's USDT faces scrutiny as Arthur Hayes warns a 30% drop in gold/Bitcoin reserves could trigger insolvency risks. - S&P downgraded USDT's stability rating to "weak" over 5.6% Bitcoin exposure exceeding overcollateralization margins. - Tether CEO dismissed criticism, claiming no "toxic" assets while regulators globally intensify reserve transparency demands. - Debate centers on balancing crypto volatility with liquidity resilience amid $34B cash shortfall and redemption risks.
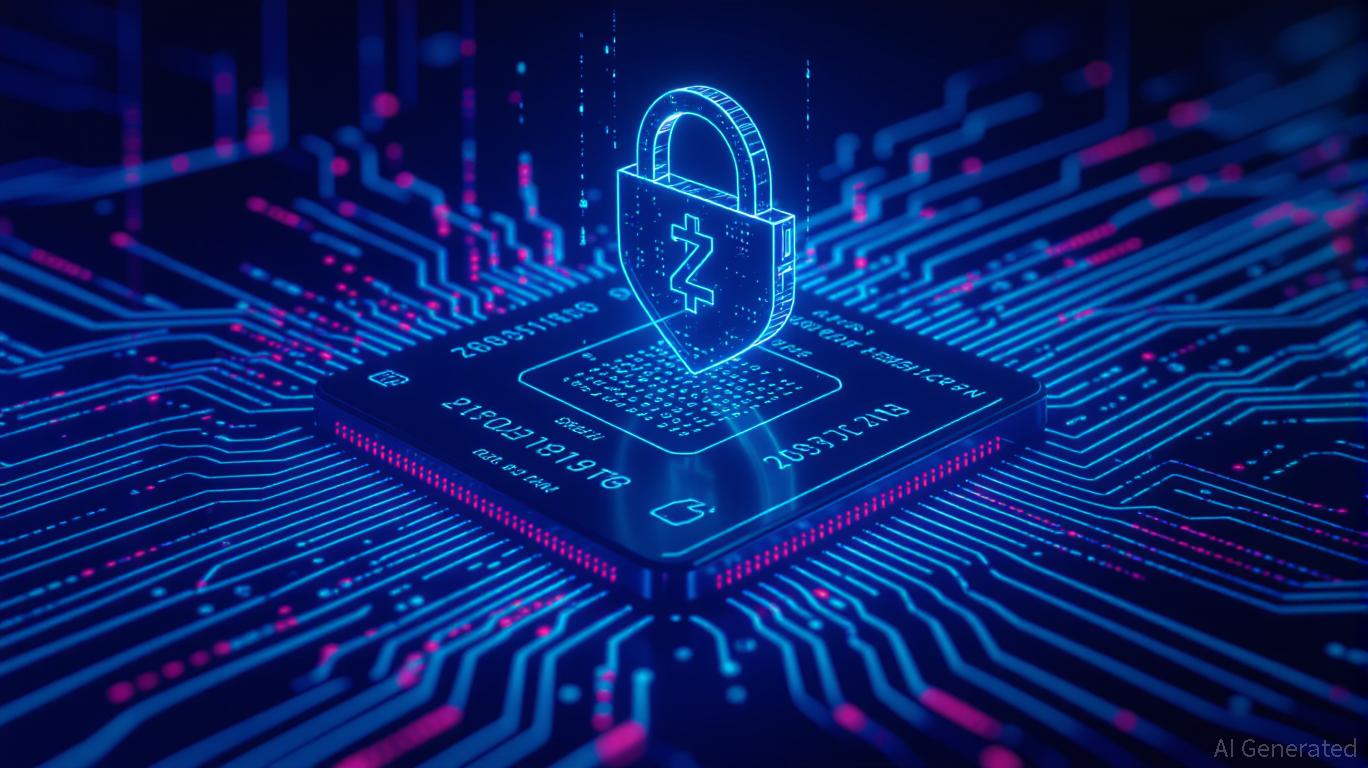
Zcash Halving and Its Effects on the Dynamics of the Cryptocurrency Market
- Zcash's halving mechanism reduces block rewards every four years, enhancing scarcity and mimicking Bitcoin's deflationary model while offering optional privacy features. - Historical halvings (2020, 2024) triggered sharp price swings, with Zcash surging 1,172% post-2024's NU5 upgrade and institutional adoption via Grayscale Zcash Trust. - Next halving projected for late 2028 faces risks from regulatory scrutiny of shielded transactions and competition from privacy coins like Monero. - Long-term investors
Zcash (ZEC) Rallies as Interest in Privacy Coins Grows: Can the Momentum Last?
- Zcash (ZEC) surged 900% in Q4 2025, peaking at $702.04, driven by institutional adoption and regulatory clarity via the CLARITY/GENIUS Acts. - The November 2025 halving reduced block rewards by 50%, historically correlating with price surges, while shielded transactions now account for 20-25% of supply. - Zcash diverged from broader crypto weakness, gaining 35% weekly in November despite Bitcoin's decline, fueled by privacy-focused retail demand and $2B+ trading volume. - Upgrades like Zashi wallet and P
Trending news
MoreBitcoin News Update: Tether's Risky Reserve Change: Exposure to Cryptocurrency and Gold Poses a Challenge to Stablecoin Stability
Bitget Daily Digest (Dec. 1) | Bitget Daily Briefing (December 1)|Long liquidations hit $478 million in the past 24 hours; Spot Chainlink ETF expected to launch this week; 55.54 million SUI unlocks today