Bearish ChainOpera AI Metrics Threaten Bullish Setup — Is a 50% Price Dip Coming?

ChainOpera AI (COAI) rebounded above $19 after a brutal 90% crash, but on-chain and momentum signals hint the rally may be running out of steam. RSI and MFI divergences show weakening demand, while speculation dominates trading — leaving the token at risk of a sharp 50% correction.
ChainOpera AI’s (COAI) price has rebounded above $19 after a brutal 90% drop between October 12 and 20. The move has renewed some optimism, but the recovery appears fragile. Behind the bounce, several technical and behavioral signals now point to growing exhaustion in the trend.
While the chart still shows a bullish setup, deeper metrics reveal cracks forming beneath the surface — ones that could decide whether COAI’s rebound continues or gives way to another correction.
Divergences Show Buyers Losing Control
The Relative Strength Index (RSI), which tracks buying versus selling strength, is flashing a standard bearish divergence.
Between October 16 and October 24, the COAI price made higher highs, while RSI printed lower highs, hinting that momentum is weakening even as the ChainOpera AI price climbs.
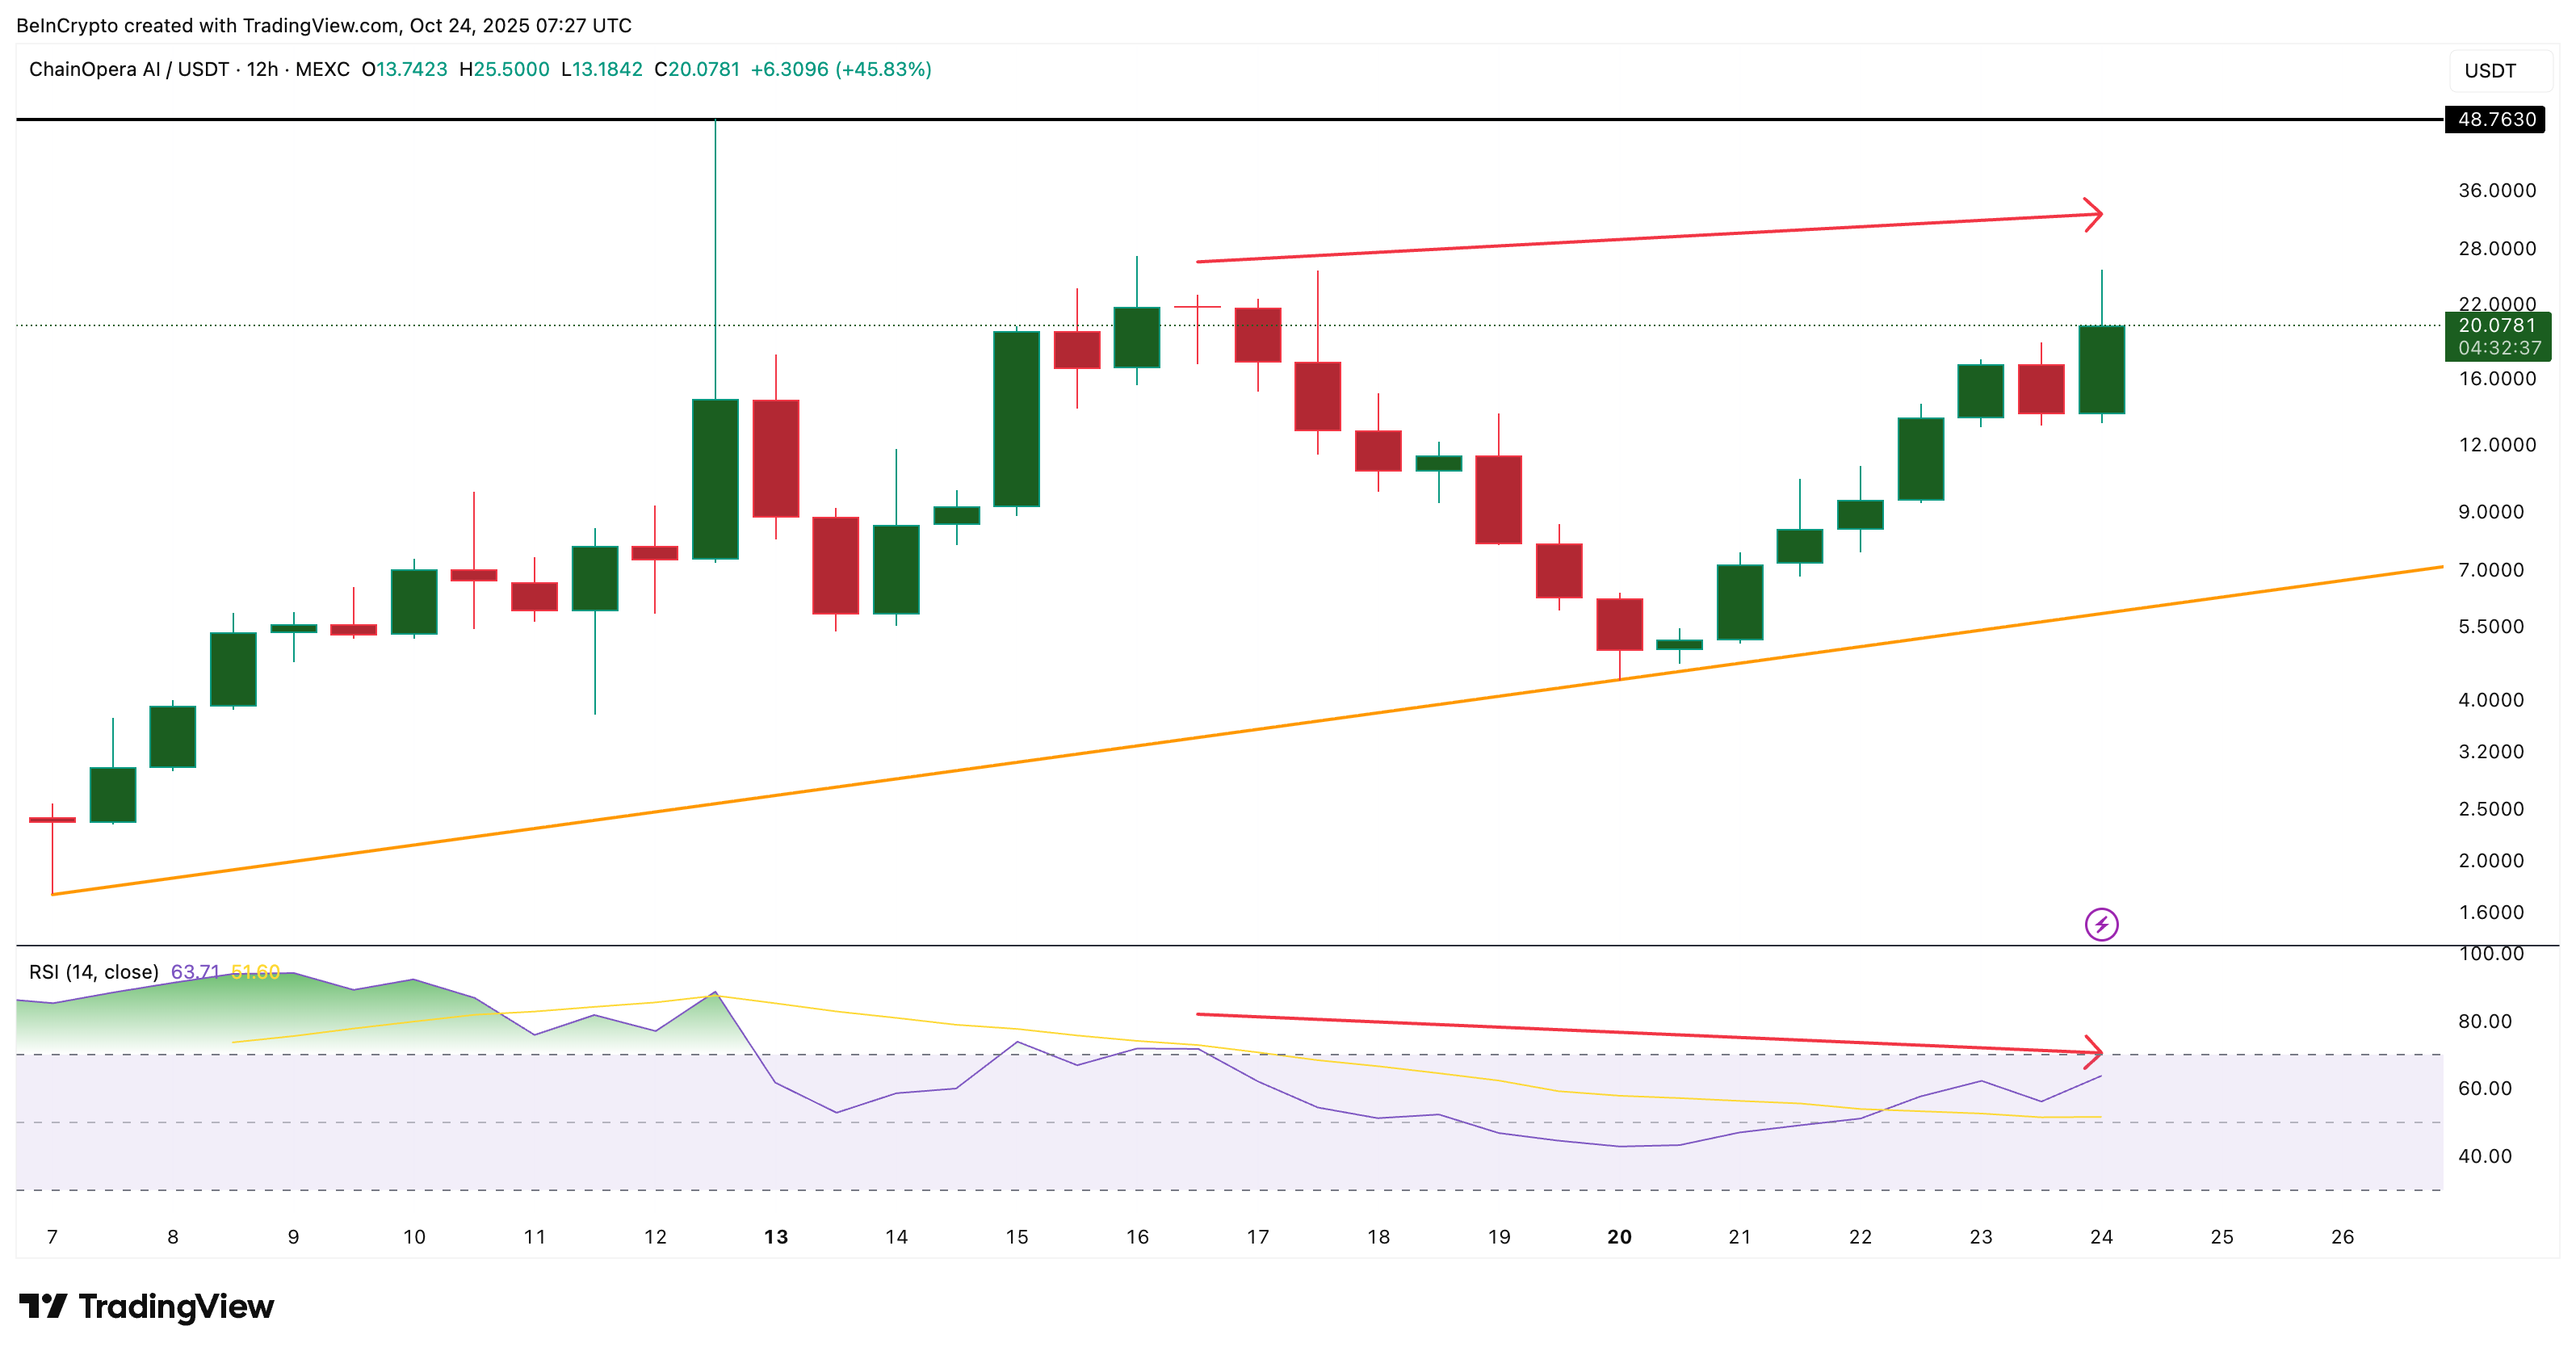 COAI Price And Bearish RSI Divergence:
The Money Flow Index (MFI), a metric that measures the real flow of money into or out of an asset, confirms that view. Between October 19 and October 23, prices formed higher lows, but MFI made lower lows. This form of bearish divergence signals that inflows are thinning out.
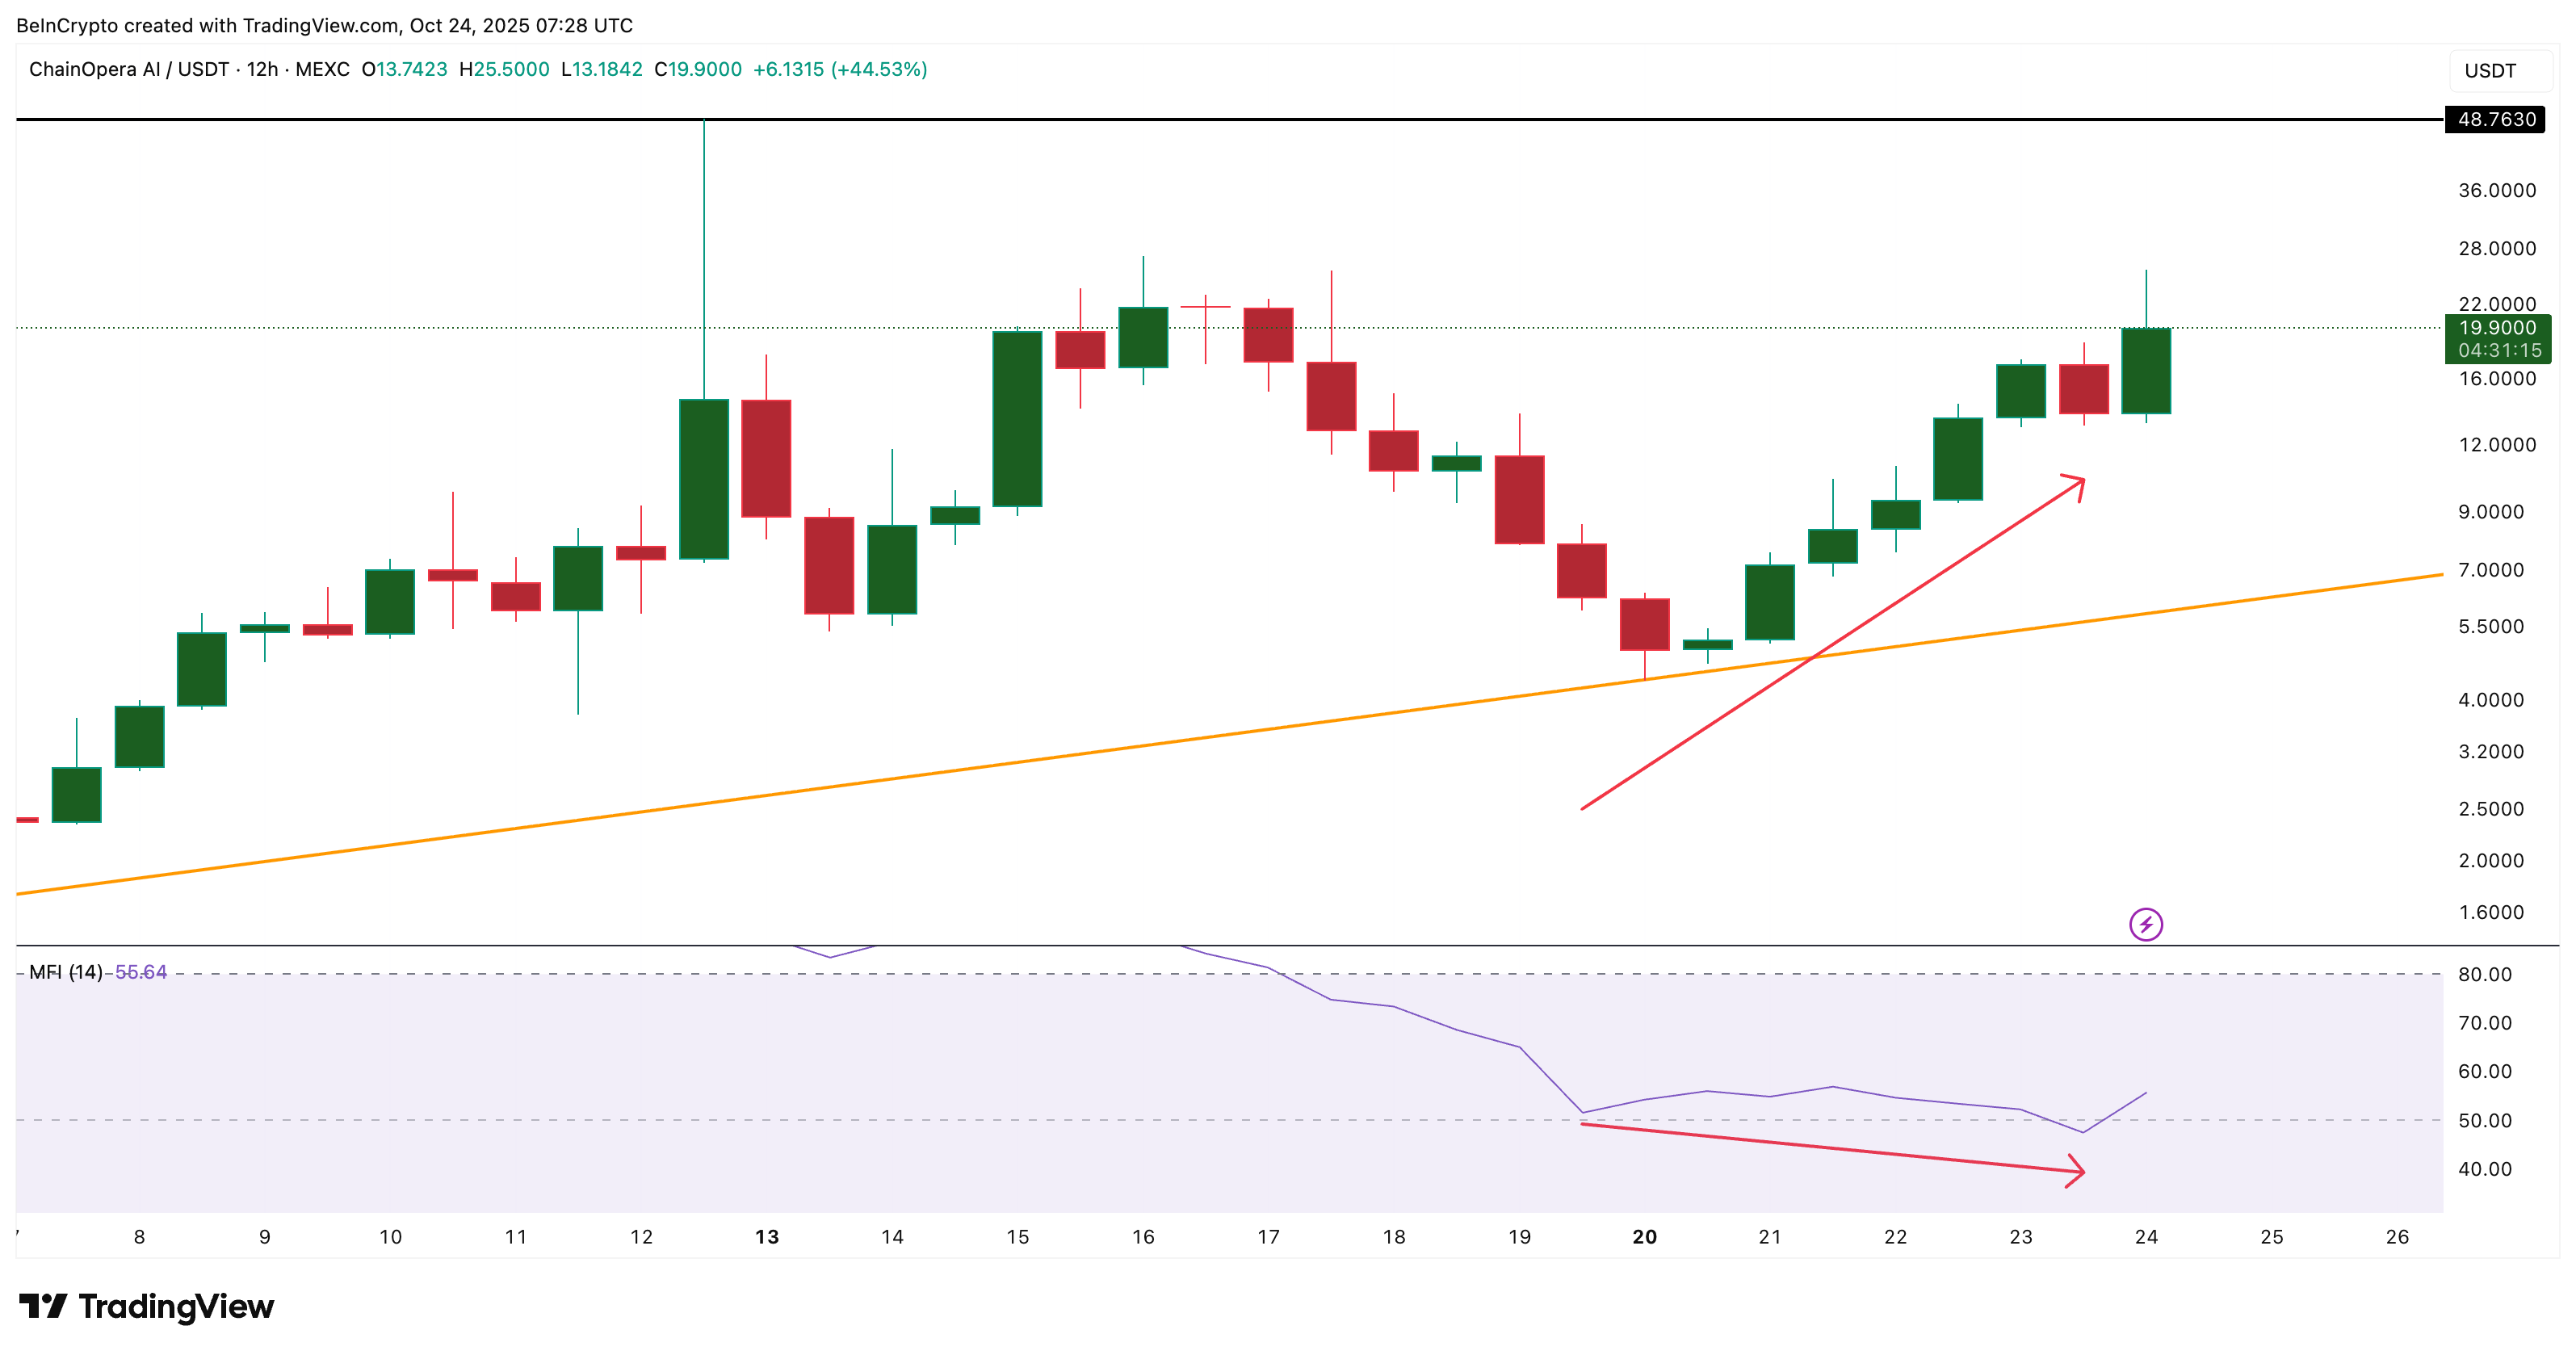 COAI Price And Bearish MFI Divergence:
When both RSI and MFI diverge from the price, it often marks the early stages of a potential trend reversal. These divergences show that while prices keep rising, buyers are no longer matching previous strength — an early sign that demand may be drying up.
In addition, speculation remains dominant. COAI’s social mentions jumped 1,300% in 24 hours, yet activity appears driven more by hype than sustained demand.
With most COAI supply still concentrated among a few large holders, this mix of momentum loss and speculative trading keeps short-term risk elevated.
Bullish Pattern Intact, but a Break Could Trigger a ChainOpera AI Price Drop
On the 12-hour chart, COAI trades within an ascending (trendline) structure, forming the base of a bullish triangle pattern that traders often associate with continuation. Fibonacci extension levels define the key breakout and support zones within this triangle.
The token faces strong resistance around $22.44, where previous advances stalled. A failure to close above this level could send prices down toward $15.52 and possibly $9.81, implying a near 50% correction from current levels.
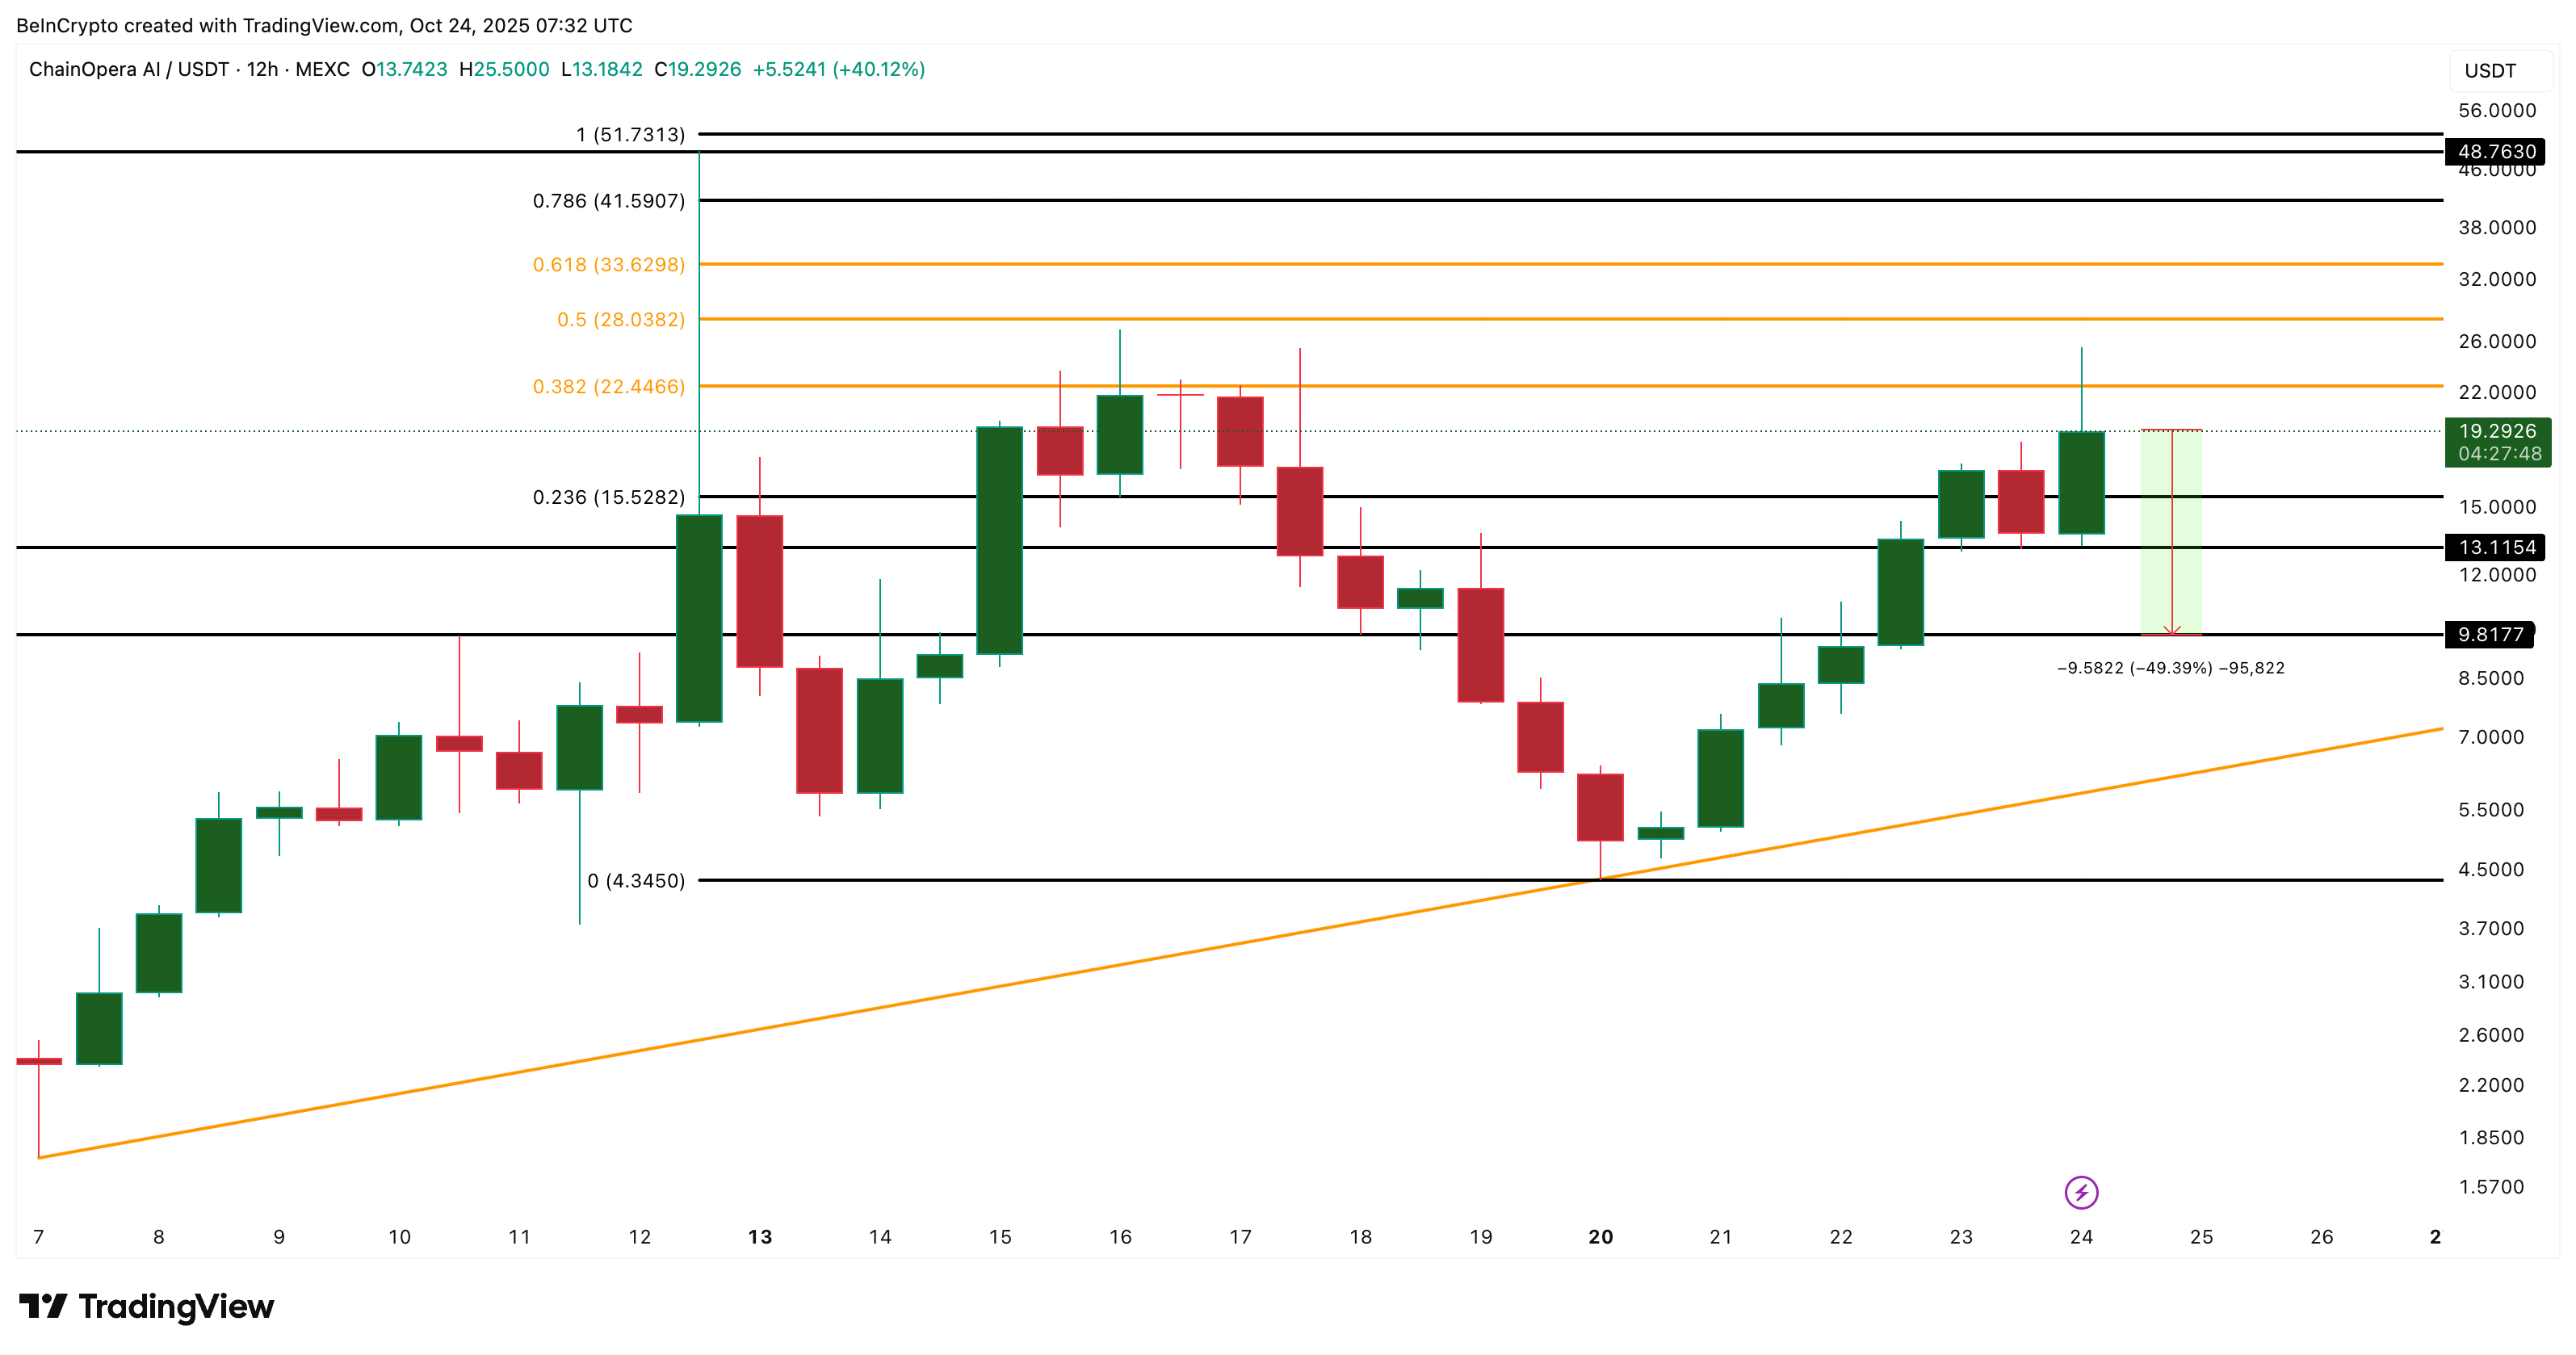 COAI Price Analysis:
However, a clear breakout above $22.44 (12-hour candle close) would invalidate this bearish setup. That would open room for targets near $28.03 and $33.62.
For now, COAI’s bullish structure remains technically valid. However, the indicators beneath it suggest the rally’s foundation may already be weakening.
Disclaimer: The content of this article solely reflects the author's opinion and does not represent the platform in any capacity. This article is not intended to serve as a reference for making investment decisions.
You may also like
Five charts to help you understand: Where does the market go after each policy storm?
After this regulatory crackdown, is it a harbinger of an impending downturn, or the beginning of a new cycle where all negative news has been fully priced in? Let’s examine the trajectory after the storm through five key policy milestones.

Mars Morning News | The crypto market rebounds across the board, Bitcoin rises above $94,500; The "CLARITY Act" draft is expected to be released this week
The crypto market has fully rebounded, with bitcoin surpassing $94,500 and US crypto-related stocks rising across the board. The US Congress is advancing the CLARITY Act to regulate cryptocurrencies. The SEC chairman stated that many ICOs are not securities transactions. Whales are holding a large number of profitable ETH long positions. Summary generated by Mars AI. The accuracy and completeness of the content generated by the Mars AI model is still being iteratively updated.

Federal Reserve’s Major Shift: From QT to RMP, How Will the Market Transform by 2026?
The article discusses the background, mechanism, and impact on financial markets of the Federal Reserve's introduction of the Reserve Management Purchases (RMP) strategy after ending Quantitative Tightening (QT) in 2025. RMP is regarded as a technical operation aimed at maintaining liquidity in the financial system, but the market interprets it as a covert easing policy. The article analyzes RMP's potential effects on risk assets, the regulatory framework, and fiscal policy, and provides strategic recommendations for institutional investors. Summary generated by Mars AI This summary was generated by the Mars AI model, and the accuracy and completeness of its content are still in the process of iterative improvement.
Rate Hike in Japan: Will Bitcoin Resist Better Than Expected?