Key Notes
- Users paid $9.7 billion in H1 2025 fees, the highest first-half total on record, with DeFi protocols capturing 63% of the total revenue.
- Average blockchain transaction costs fell 86% since 2021, with daily transactions increasing 2.7 times to 169 million.
- Protocols distributed $1.9 billion to token holders in Q3 2025, an all-time high, as the regulatory environment improved for value distribution. .
Investment firm 1kx published its H1 2025 Onchain Revenue Report on Oct. 30, projecting total onchain fees will reach $19.8 billion in 2025, a 35% year-over-year increase.
The report found application-layer fees grew 126% YoY while blockchain-layer fees declined. Users paid $9.7 billion in onchain fees during H1 2025, the highest first-half total on record.
The analysis examined 1,244 protocols across six sectors using data from Dune, TokenTerminal, and DeFiLlama, according to 1kx’s H1 2025 Onchain Revenue Report .
The dataset covered 2020 through Q3 2025, categorizing protocols into blockchains, decentralized finance, decentralized physical infrastructure networks, wallets, middleware, and consumer applications.
DeFi protocols generated 63% of H1 2025 fees at $6.1 billion, led by decentralized exchanges, perpetual trading platforms, and lending markets.
Blockchains accounted for 22% at $2.1 billion, down from 56% in 2021. Wallets captured 8%, consumer applications 6%, DePIN 1%, and middleware 1%. Fee-generating protocols increased from 125 in 2021 to 969 in H1 2025.
Blockchain Efficiency Gains Reshape Fee Distribution
Average blockchain transaction fees fell 86% from the 2021 peak, driven by Ethereum’s ETH $3 764 24h volatility: 5.2% Market cap: $453.54 B Vol. 24h: $40.45 B scaling efforts.
Ethereum generated over 40% of all on-chain fees in 2021 but less than 3% in 2025. The network’s EIP-1550 mechanism and Layer 2 adoption reduced average costs by 95%.
Daily transactions increased 2.7 times to 169 million, while monthly active wallets rose 5.3 times to 273 million.
New Protocols Capture Market Share in High-Growth Sectors
Solana-based SOL $184.3 24h volatility: 5.8% Market cap: $101.34 B Vol. 24h: $9.49 B DEXs Meteora and Raydium RAY $1.63 24h volatility: 10.1% Market cap: $436.79 M Vol. 24h: $53.71 M captured share in H1 2025, while Uniswap’s portion declined from 44% to 16%. Hyperliquid HYPE $45.55 24h volatility: 3.9% Market cap: $12.36 B Vol. 24h: $1.05 B , launched less than one year ago, generated 35% of derivatives fees.
Jupiter JUP $0.39 24h volatility: 5.9% Market cap: $1.26 B Vol. 24h: $62.60 M increased its perpetual trading share from 5% to 45%. The report noted 32 protocols reached $100 million in annual fees within one year of launch.
Phantom wallet generated 30% of wallet sector fees after beginning monetization in Q4 2024. Binance Wallet’s Bubblemaps integration added transparency tools on Oct. 29. Pump.fun generated approximately $250 million in Q1 2025 fees.
Protocols distributed $1.9 billion to token holders in Q3 2025 through buybacks and burns. Applications reduced incentive emissions from $2.8 billion in H2 2021 to under $0.1 billion in H1 2025.
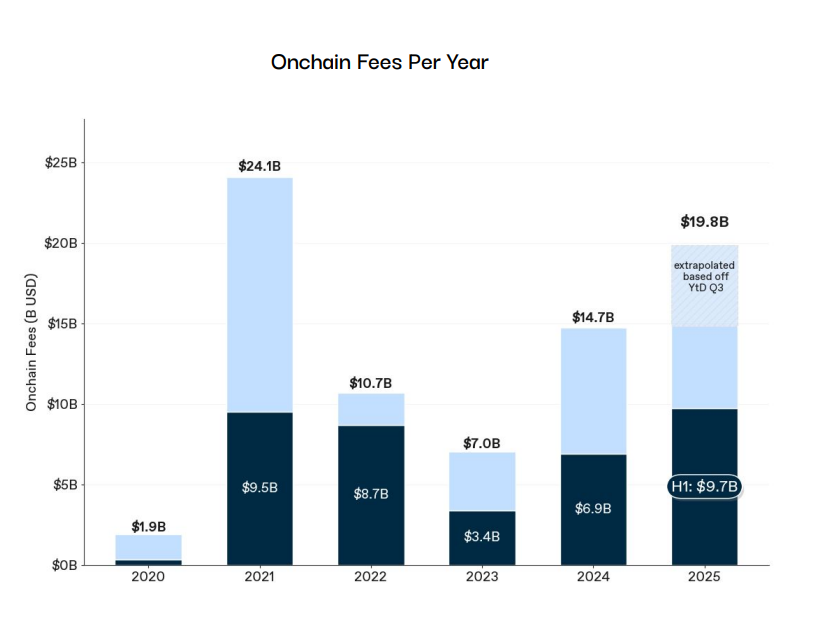
Bar charts showcasing on-chain fees organized by year. | Source: 1kx report
Real-world asset tokenization fees increased 50 times YoY, with Ondo Finance expanding its $1.8 billion tokenization market to BNB Chain BNB $1 076 24h volatility: 2.4% Market cap: $148.04 B Vol. 24h: $3.07 B in Oct. 2025.
The report projects 2026 fees will reach $32 billion, a 63% increase driven by applications. The analysis excluded Bitcoin BTC $107 654 24h volatility: 3.2% Market cap: $2.15 T Vol. 24h: $75.93 B , which represents 58% of crypto market capitalization, as it functions primarily as a store of value.
next