Zcash’s 400% October Run Shows Signs of Exhaustion — Is a Pullback Next?

Zcash’s 400% rally may be hitting a crossroads. Momentum and money flow show early weakness, but the bullish structure still holds — for now.
Zcash (ZEC) has turned heads with a near 400% surge in October and a 44.2% jump this week. Even the past 24 hours added another 6.6%, showing strong buying pressure. But while the Zcash price keeps climbing, signs of exhaustion are surfacing.
Momentum indicators now point to a pullback risk, even as Zcash stays inside a bullish structure.
Pullback Risks Grow as Price Outpaces Momentum
Between October 11 and October 29, Zcash’s price kept making higher highs, while the Relative Strength Index (RSI) made lower highs. RSI is a momentum indicator that measures buying versus selling strength. When prices rise while the RSI falls, it signals bearish divergence — indicating that momentum isn’t confirming the move.
This divergence has come amid Zcash’s 400% month-on-month rally, suggesting that the surge itself is now driving RSI risk. In other words, price has moved too far, too fast, and RSI hasn’t followed. That imbalance usually hints at a cooldown.
Want more token insights like this? Sign up for Editor Harsh Notariya’s Daily Crypto Newsletter.
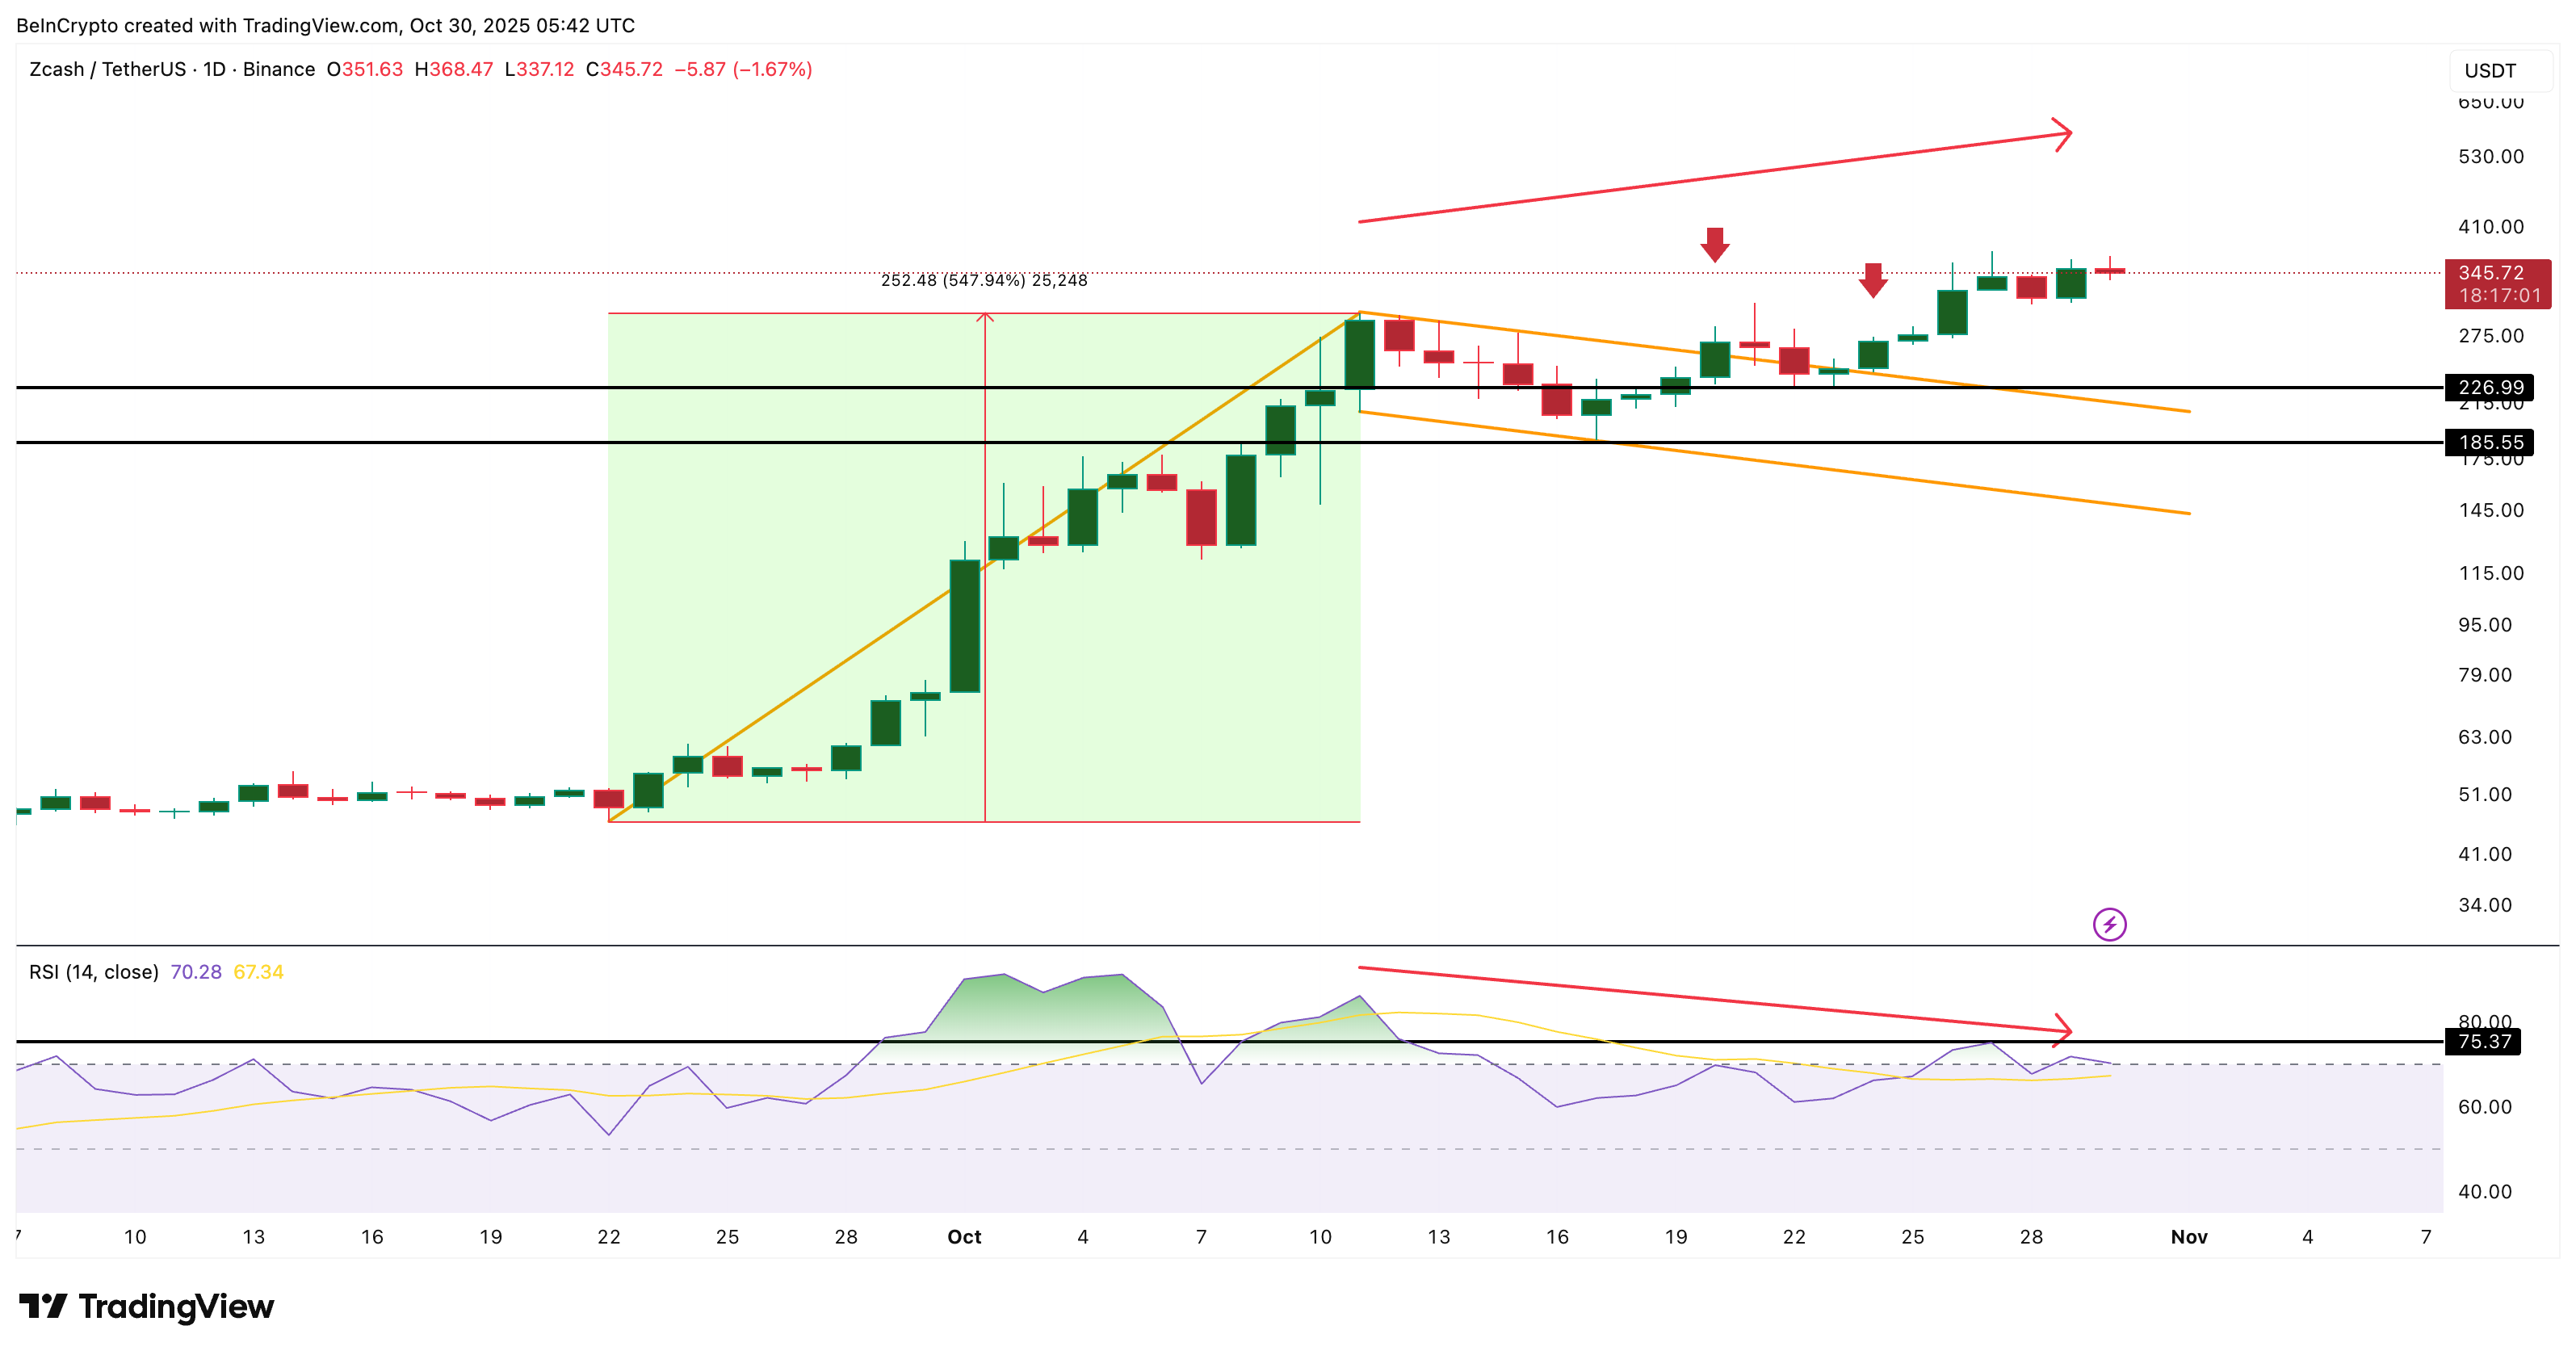 ZEC Price And Building Bearish Divergence:
TradingView
ZEC Price And Building Bearish Divergence:
TradingView
Note: While this kind of bearish divergence on the daily chart often signals a trend reversal, ZEC’s near-term history shows commendable price strength. That strength might limit the pullback risk, if and when the Zcash price corrects.
Notably, Zcash is still riding its flag-breakout momentum, and the broader rally looks intact.
At the same time, the Chaikin Money Flow (CMF) — which tracks how much big money is flowing in or out — has been trending down since the last few sessions. It’s now hovering near zero, meaning large investors may be booking profits instead of adding exposure.
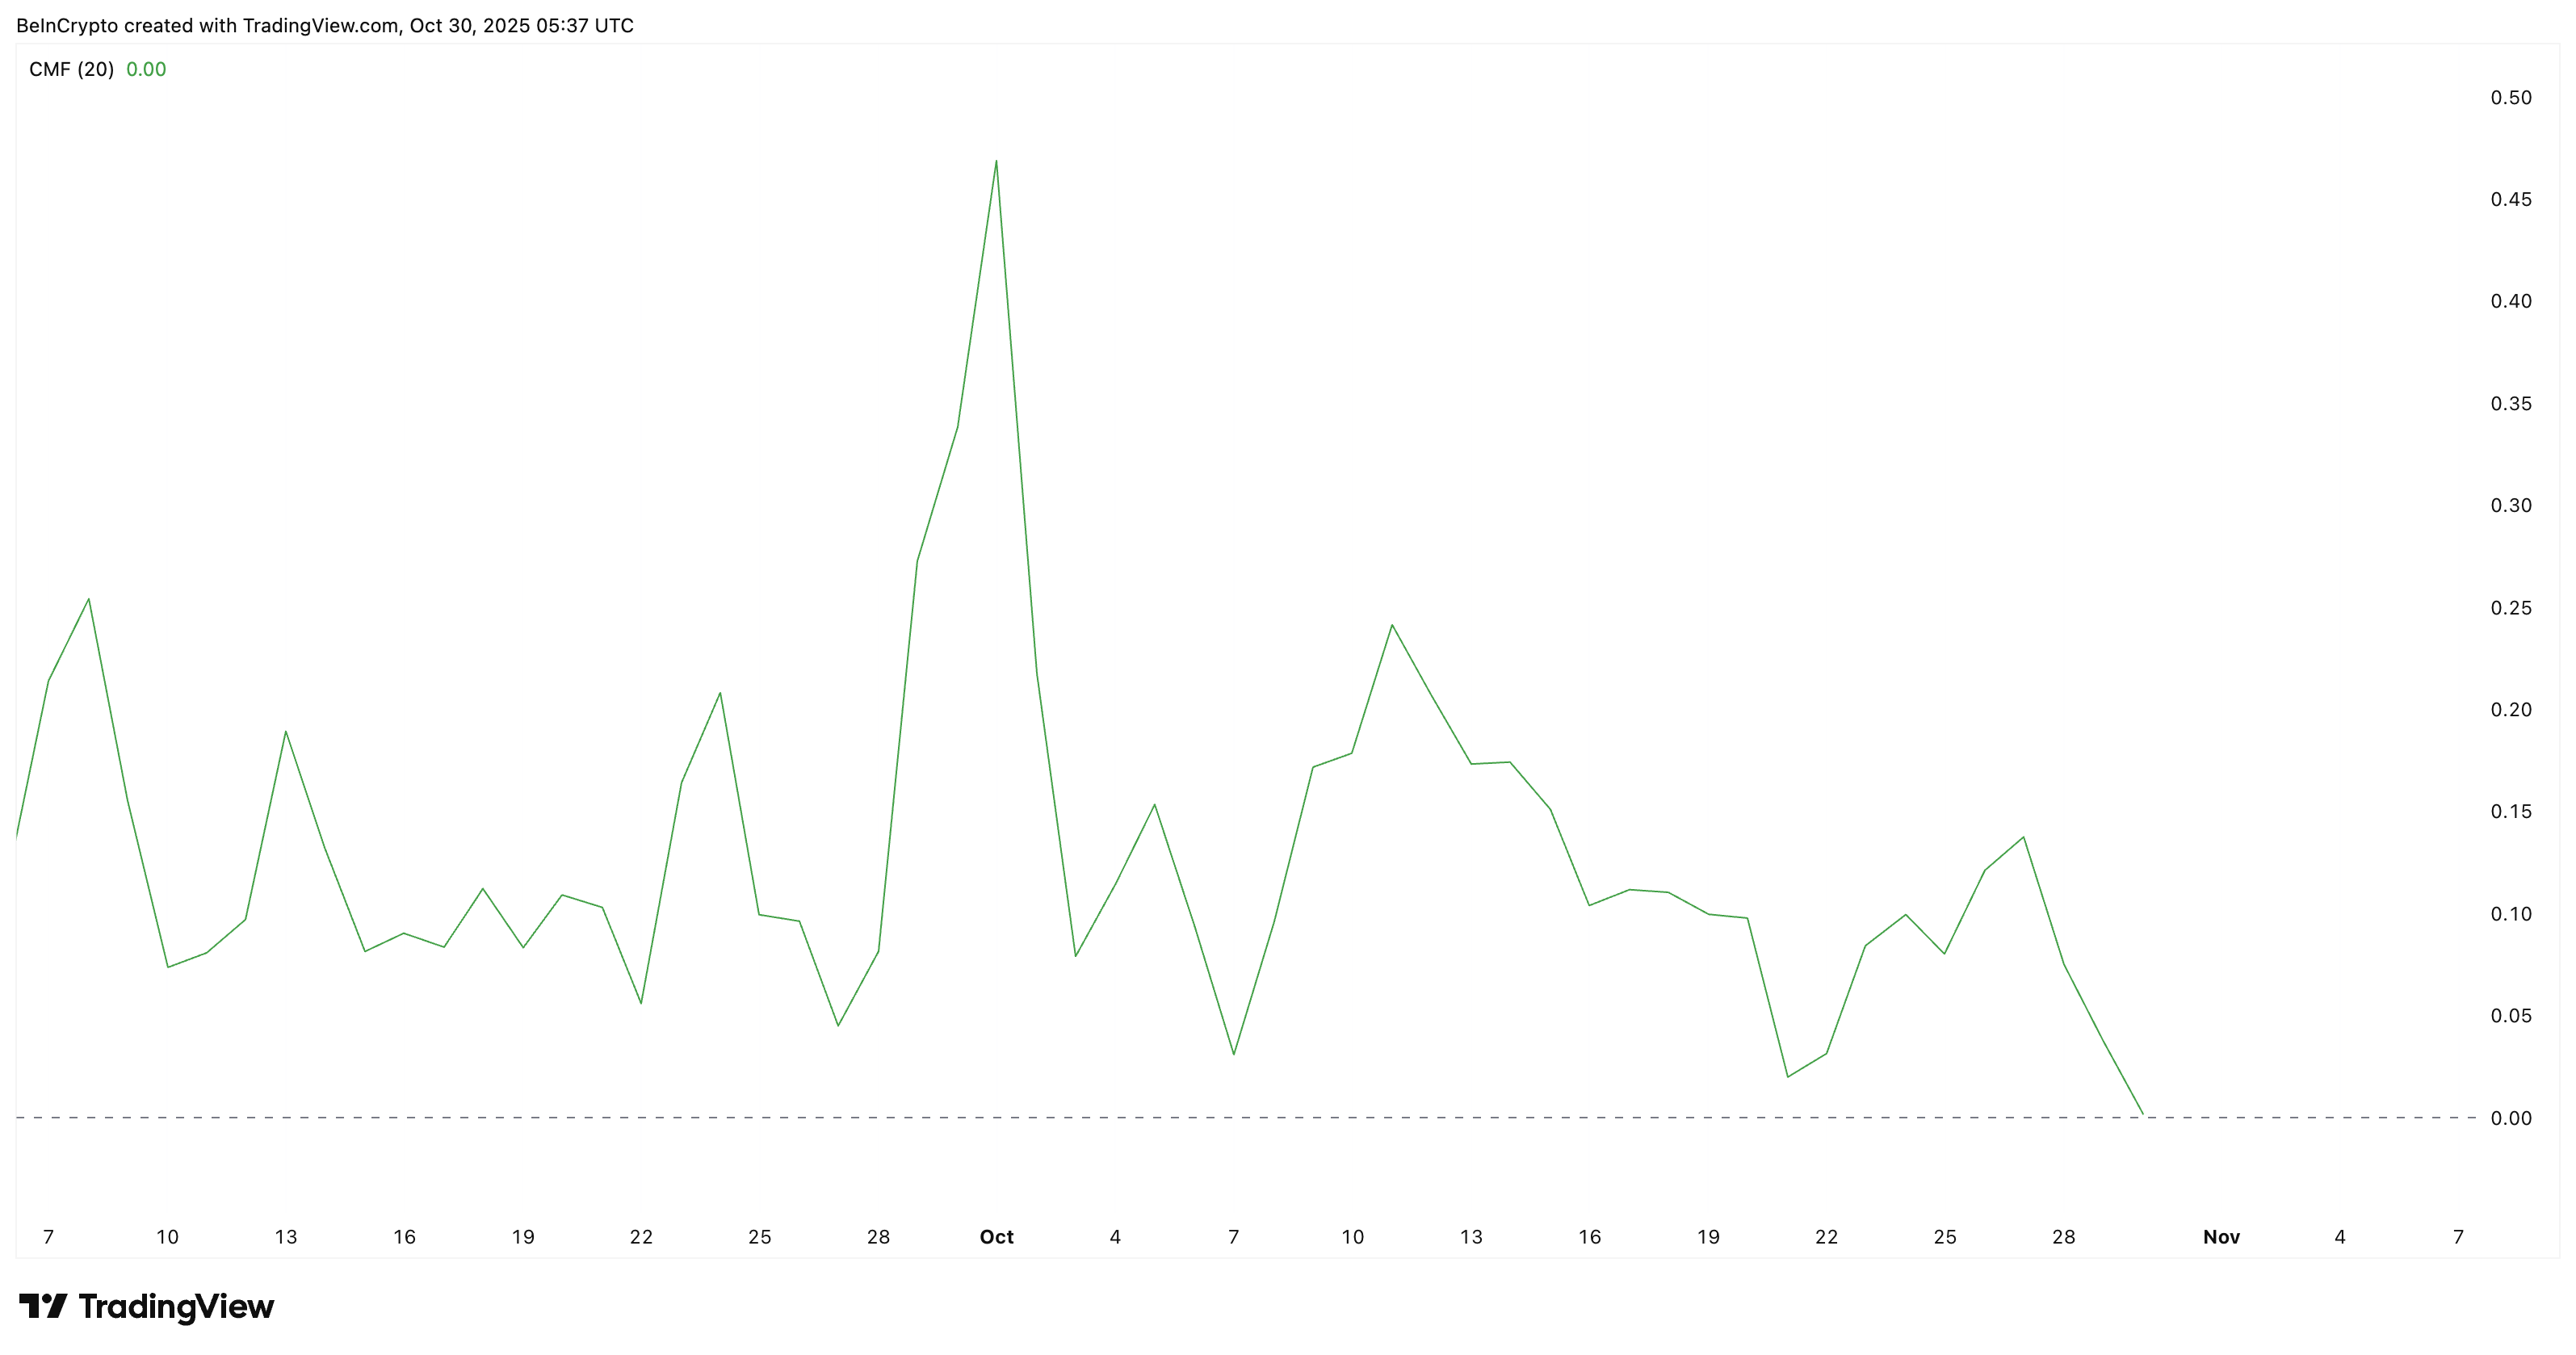 ZCash CMF. Source:
TradingView
ZCash CMF. Source:
TradingView
For Zcash to regain momentum, CMF must turn higher, and RSI should rise past 75. RSI moving above 75 alongside rising prices will put momentum and price in sync, at least in the short term. And that could invalidate the pullback bias.
Long Liquidations Add to the Pullback Risk
ZEC’s liquidation map from Bybit alone shows how heavily the market is tilted toward long positions. Over $20.8 million in long leverage is currently stacked against only $10.7 million in shorts. This means most traders are still betting on upside.
Such positioning raises the long squeeze risk — a sharp move down that forces overleveraged longs to close positions, pushing prices even lower. Even a small drop could trigger this, especially with Zcash’s volatility history.
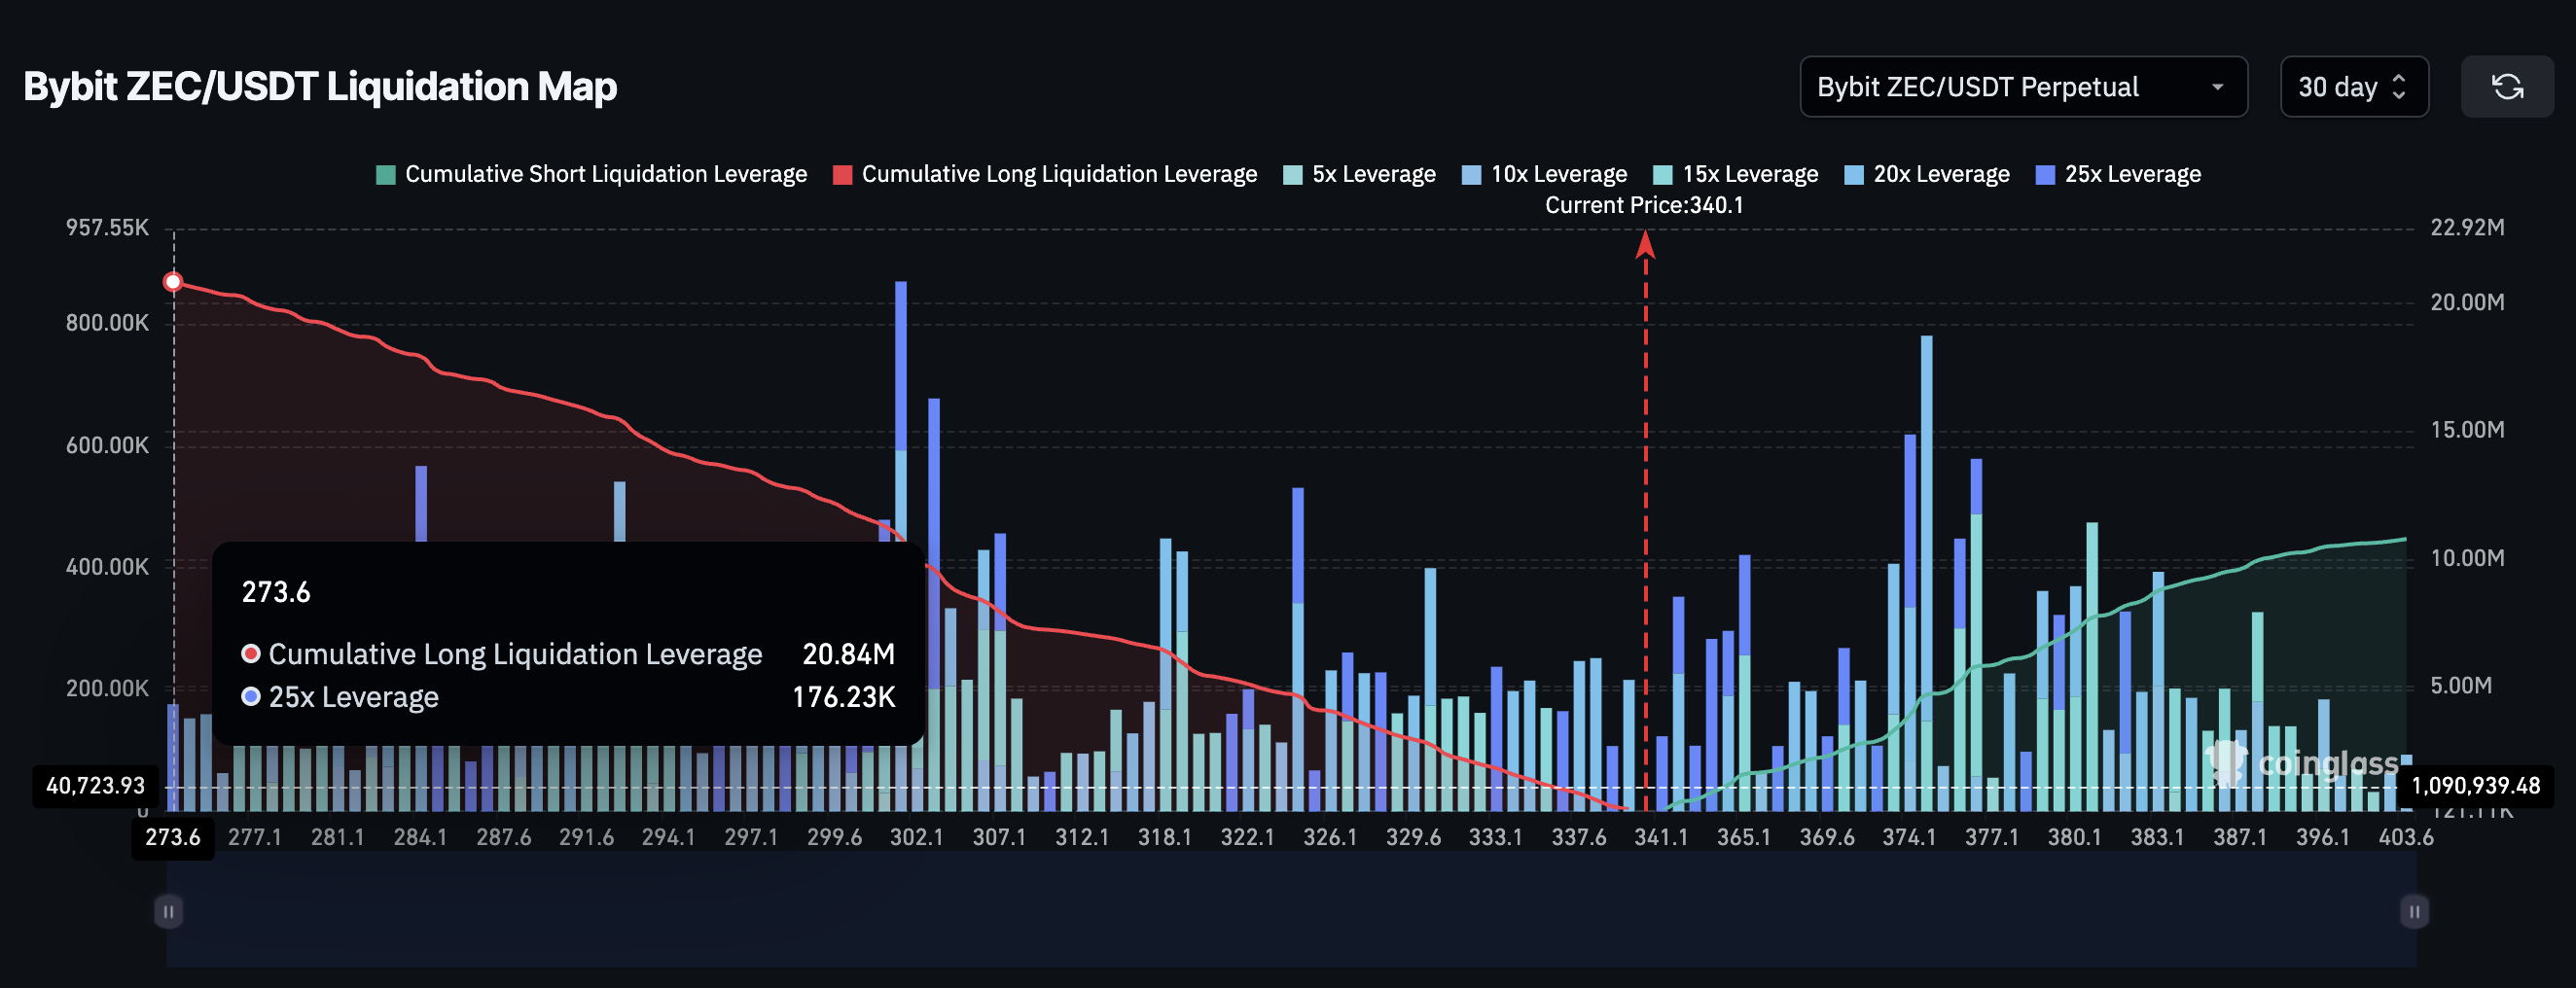 ZEC Liquidation Map:
Coinglass
ZEC Liquidation Map:
Coinglass
The biggest liquidation clusters sit between $308 and $295, making them high-risk zones if selling pressure builds. Given that the ZEC price responds to derivatives, the price pullback risk remains unless leverage cools.
Bullish Zcash Price Structure Holds, But Not Without Risks
Despite these short-term warning signs, Zcash’s technical structure remains bullish. On the 12-hour chart, ZEC trades inside an ascending channel, a pattern that usually leads to upward breakouts.
The upper trendline, though, is weak — with only two touchpoints, meaning a move above it could be explosive if bulls retake control. The key level to watch is $365, which has rejected every advance since October 27.
If ZEC breaks above it, $382 and $400 become immediate targets, with $400 acting as a strong psychological barrier. A close above $400 could open the door to $456 and even $548, based on Fibonacci extensions.
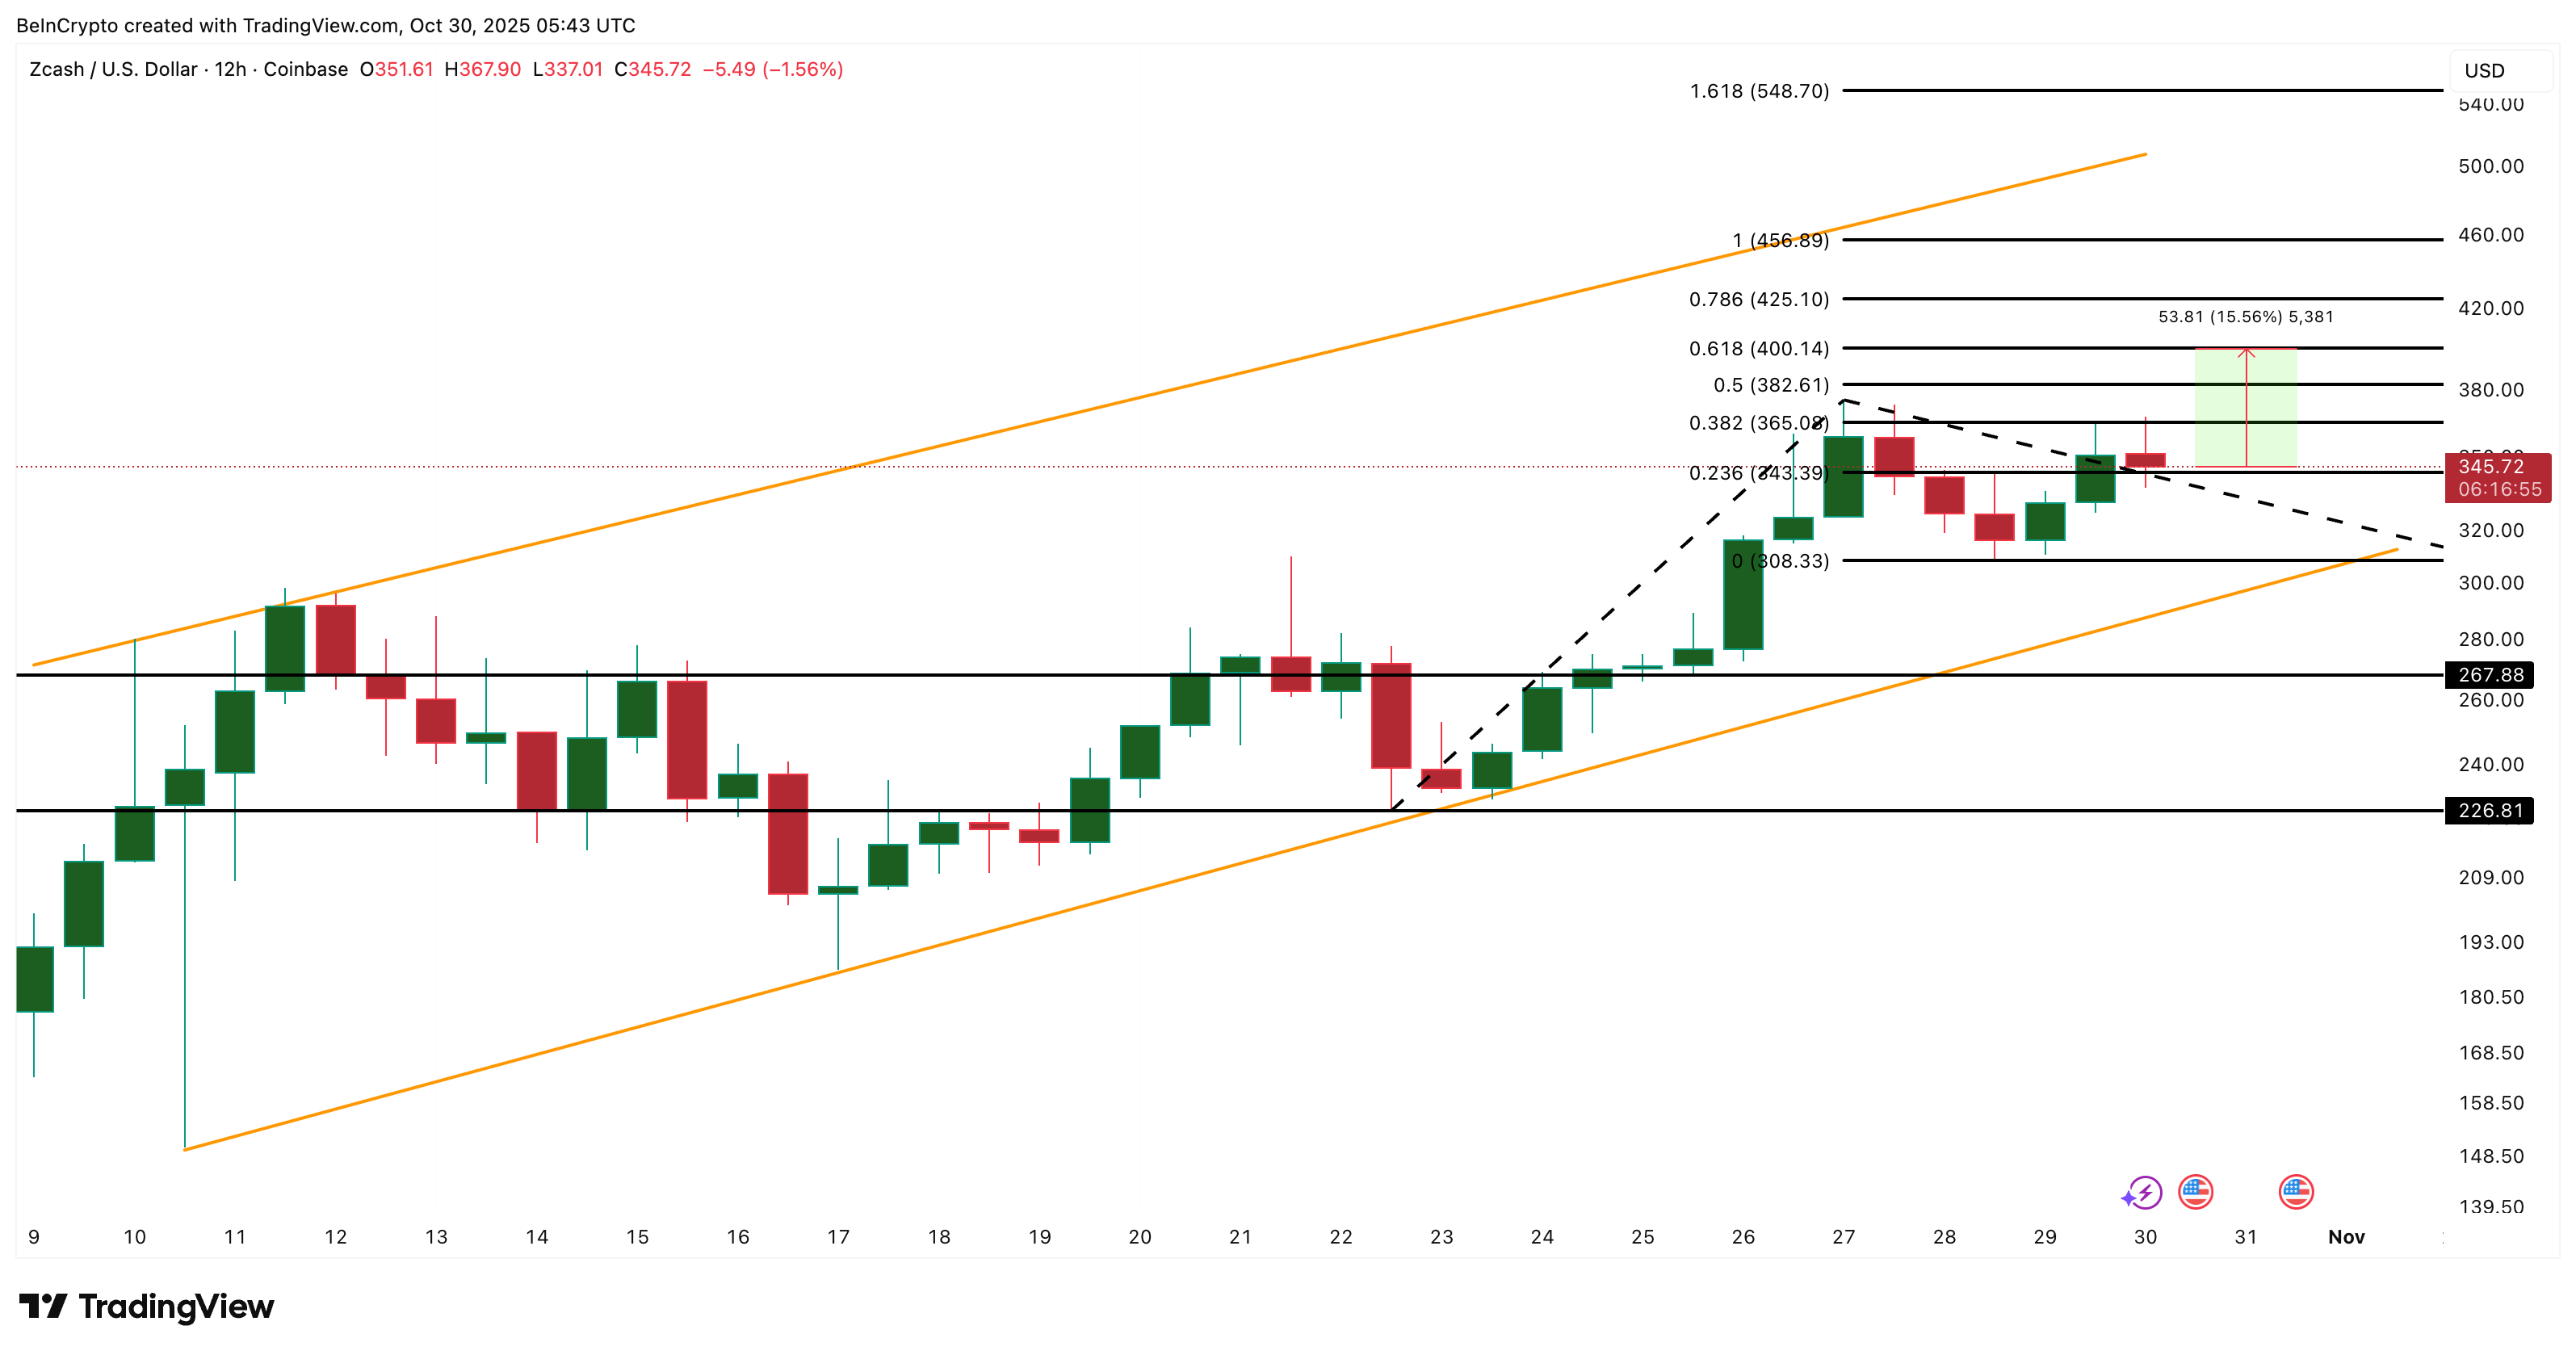 Zcash Price Analysis:
TradingView
Zcash Price Analysis:
TradingView
On the downside, $308 remains critical support. A sustained fall below it could send ZEC toward $267 or $226, turning the current pattern from bullish to corrective.
The break under $308 would also trigger long liquidations, as mentioned earlier. That could even break the bullish channel structure and push the Zcash price towards $267 or lower.
Disclaimer: The content of this article solely reflects the author's opinion and does not represent the platform in any capacity. This article is not intended to serve as a reference for making investment decisions.
You may also like
T3 FCU Freezes $300 Million in Illicit Crypto Funds
BlockDAG Captures the Spotlight with Buyer Battles & $435M Presale as Stellar Fades & Ethereum Aims for $10K
BitMine Acquires 202k Ethereum Amid Market Volatility
Bitcoin briefly dropped to $106,000, is it really game over?
After the Federal Reserve implemented interest rate cuts, the market's short-term sentiment reversed, but macroeconomic data still supports a medium-term easing outlook.