

Date: Fri, Oct 31, 2025 | 03:30 PM GMT
The cryptocurrency market is making a slight recovery from yesterday’s heavy selloff that triggered over $1 billion in liquidations , dragging Ethereum (ETH) to a low of $3,679 before buyers stepped in. ETH has since bounced back and is currently trading around $3,860, up by more than 2% today.
But beyond the recovery, the technical setup on lower timeframes suggests something more — a potential bullish reversal may be brewing.
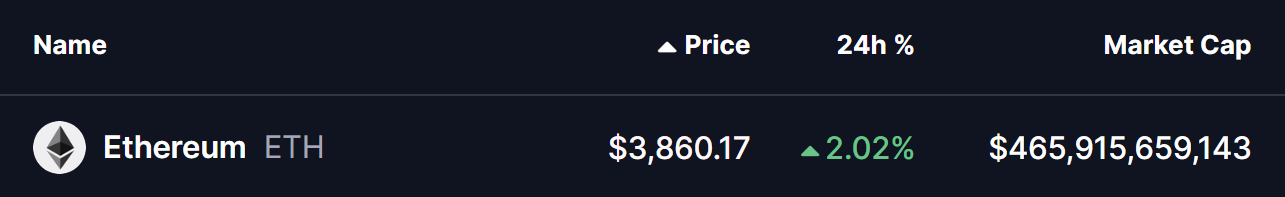 Source: Coinmarketcap
Descending Broadening Wedge in Play
On the 1-hour chart, ETH has been forming a descending broadening wedge, a bullish reversal pattern that typically appears during corrective downtrends. The structure often signals a loss of bearish momentum and precedes a potential trend reversal.
Recently, ETH’s decline brought its price to the wedge’s lower boundary near $3,679, where strong buying pressure emerged. This support level has repeatedly acted as a rebound zone over the past few sessions. Following this test, ETH bounced to current level of $3,859 and is now consolidating just below its 200-hour moving average (MA) at $3,951.
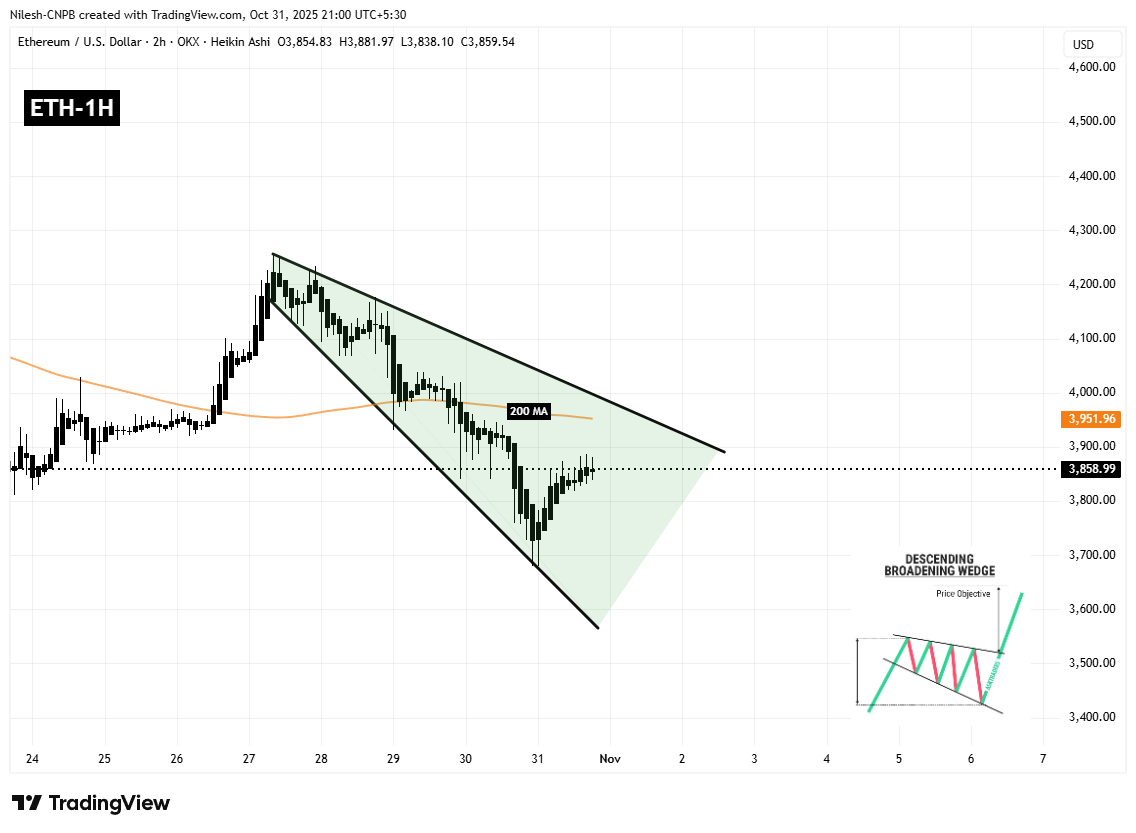 Ethereum (ETH) 1H Chart/Coinsprobe (Source: Tradingview)
This confluence between wedge support and the key MA level makes the current zone a crucial battleground between bulls and bears.
What’s Next for ETH?
If Ethereum manages to defend the wedge support and close decisively above the 200-hour MA, it could pave the way for a push toward the wedge’s upper resistance trendline — potentially leading to a breakout. A confirmed breakout, followed by a successful retest, could open the door for an extended rally toward the $4,100–$4,200 region.
However, if ETH fails to sustain above $3,800, the price may revisit the lower support trendline once more before any significant upside move unfolds.