Date: Sun, Nov 02, 2025 | 05:30 AM GMT
The cryptocurrency market continues to build on its early November momentum, with both Bitcoin (BTC) and Ethereum (ETH) trading in green. Several memecoins are also joining the upside wave — including Bonk (BONK), which is showing early signs of strength.
BONK is trading higher today with modest gains, but what’s more important is the chart structure — which now displays a bullish technical pattern that could hint at a potential breakout in the near term.
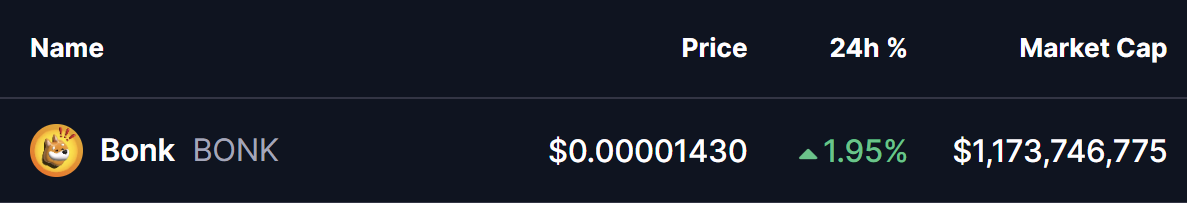 Source: Coinmarketcap
Descending Broadening Wedge Pattern in Play
On the 2-hour chart, BONK has been trading within a descending broadening wedge — a bullish pattern that often develops during a downtrend and signals a potential reversal once the price breaks upward.
During the latest pullback, BONK dropped to test its lower wedge support near $0.00001274, where buyers stepped in and defended the level. Since then, the token has rebounded sharply, climbing back toward $0.00001429, positioning itself just below the wedge’s upper resistance line.
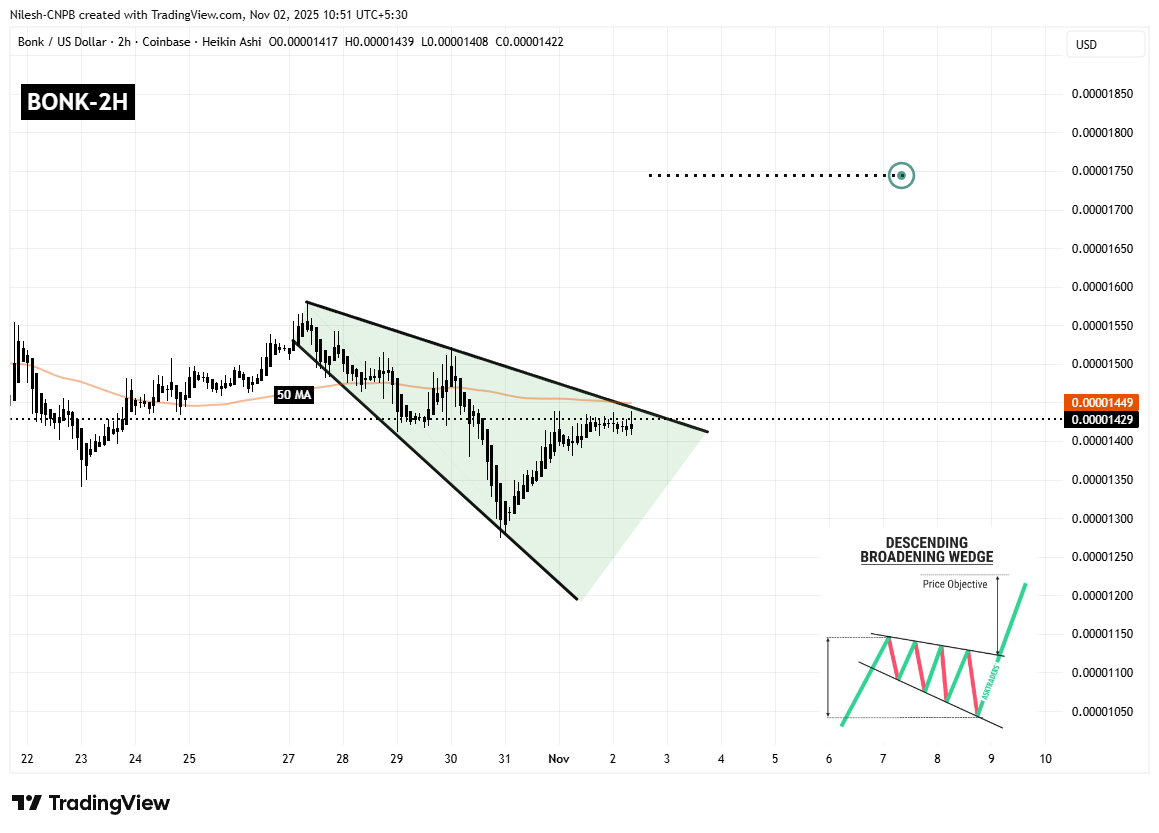 Bonk (BONK) 2H Chart/Coinsprobe (Source: Tradingview)
The price action is tightening around this resistance zone — a technical condition that typically precedes high-volatility breakout moves.
What’s Next for BONK?
If bulls manage to push BONK above the upper wedge trendline and reclaim the 50 MA, it could confirm a breakout, potentially driving the token toward $0.00001745 — a move that represents an approximate 22% upside from current levels.
However, if BONK fails to break above resistance, the token may consolidate within the wedge for a while longer. In that case, the $0.00001380 level will be a key short-term support to monitor.
At the moment, the technical outlook looks encouraging, and as overall market sentiment remains positive, BONK could soon emerge as one of the leading memecoins driving the next leg of the rally.