
Data Breakdown: The $100,000 Defense—Will Bitcoin Rebound or Dip Further?

The market may have entered a mild bear market.
Original Title: "Defending $100,000: Data Reveals Whether Bitcoin Will Rebound or Continue to Decline?"
Original Authors: Chris Beamish, CryptoVizArt, Antoine Colpaert, Glassnode
Original Translation: Luffy, Foresight News
Summary
- Bitcoin has fallen below the short-term holder cost basis (around $112,500), confirming weakened demand and officially ending the previous bull market phase. The price is currently consolidating near $100,000, down about 21% from its all-time high (ATH).
- About 71% of bitcoin supply remains in profit, consistent with characteristics of a mid-term correction. The relative unrealized loss rate of 3.1% indicates the market is in a mild bear phase, not a deep capitulation.
- Since July, long-term holders have reduced their bitcoin supply by 300,000 coins. Even as prices fall, selling continues—unlike the "selling into strength" pattern seen earlier in this cycle.
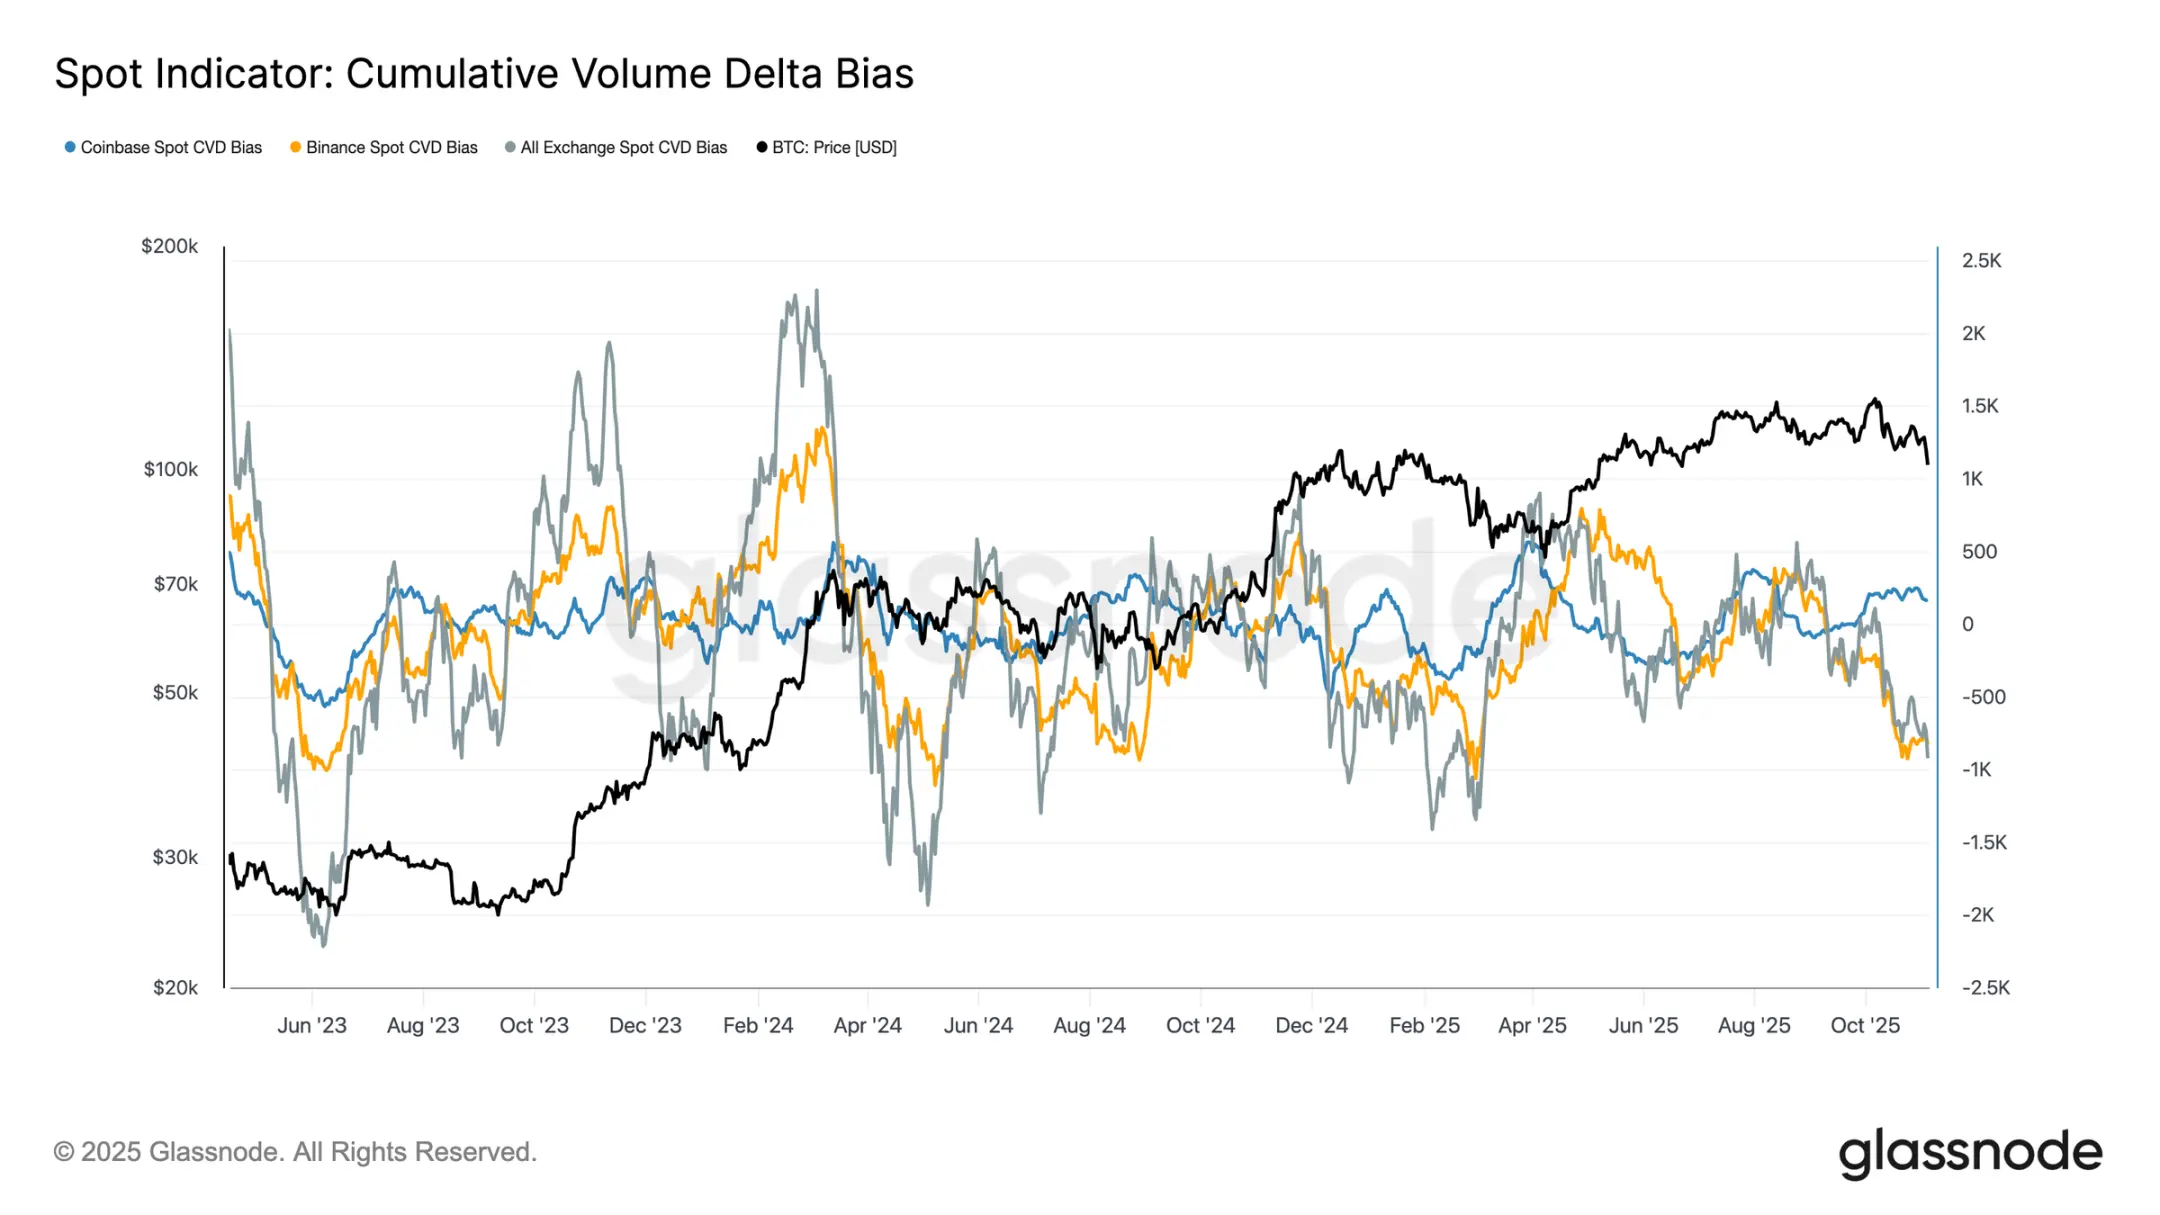
- U.S. spot bitcoin ETFs have seen continuous outflows ($150 million - $700 million daily), and cumulative spot volume delta (CVD) on major exchanges shows persistent selling pressure and weakened self-directed trading demand.
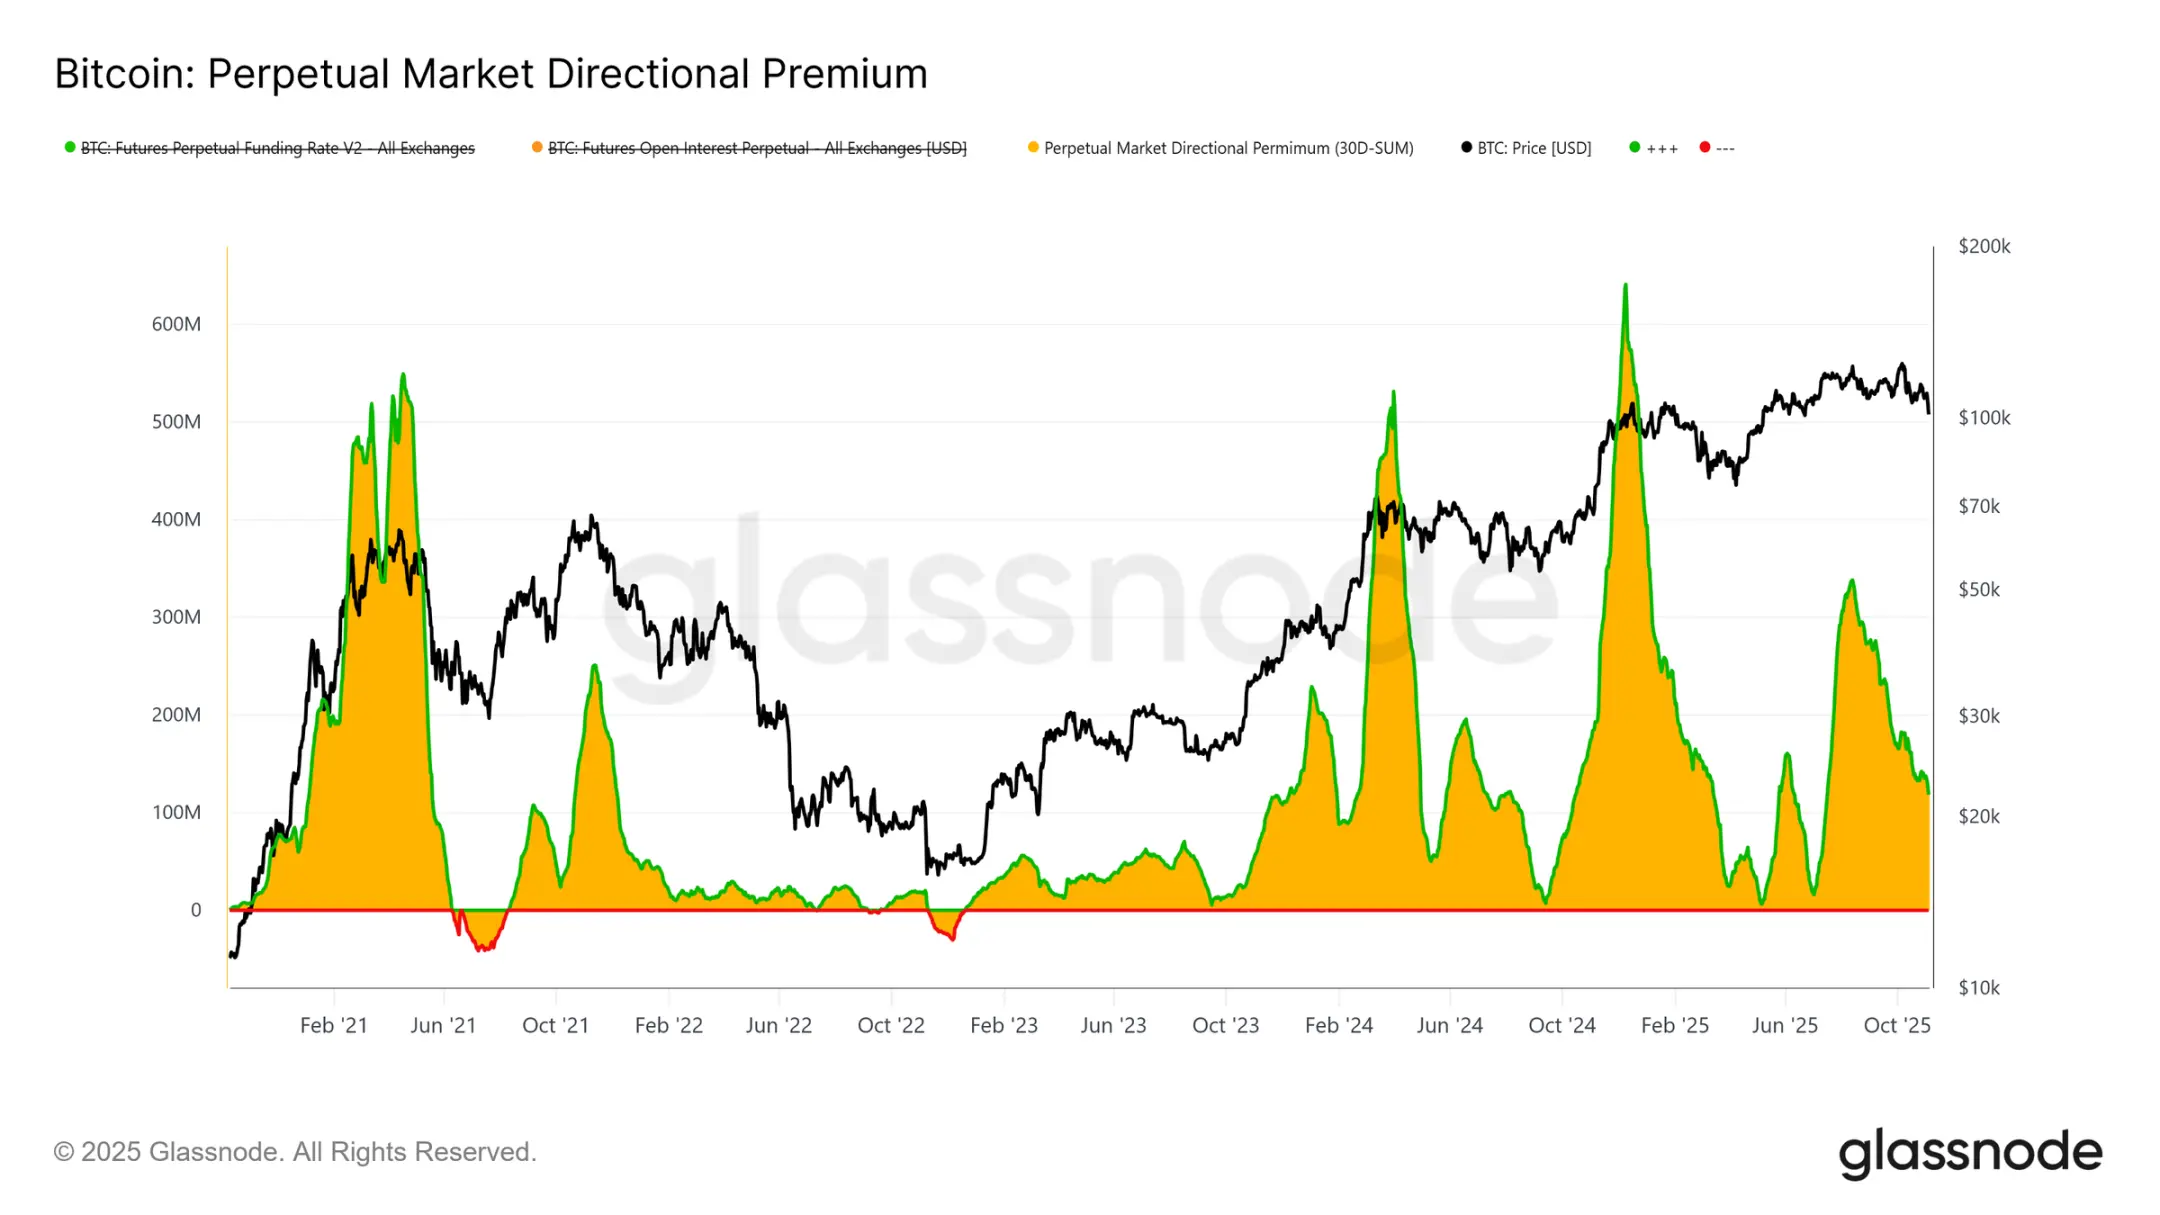
- Directional premium in the perpetual contract market has dropped from $338 million per month in April to $118 million, indicating traders are reducing leveraged long positions.
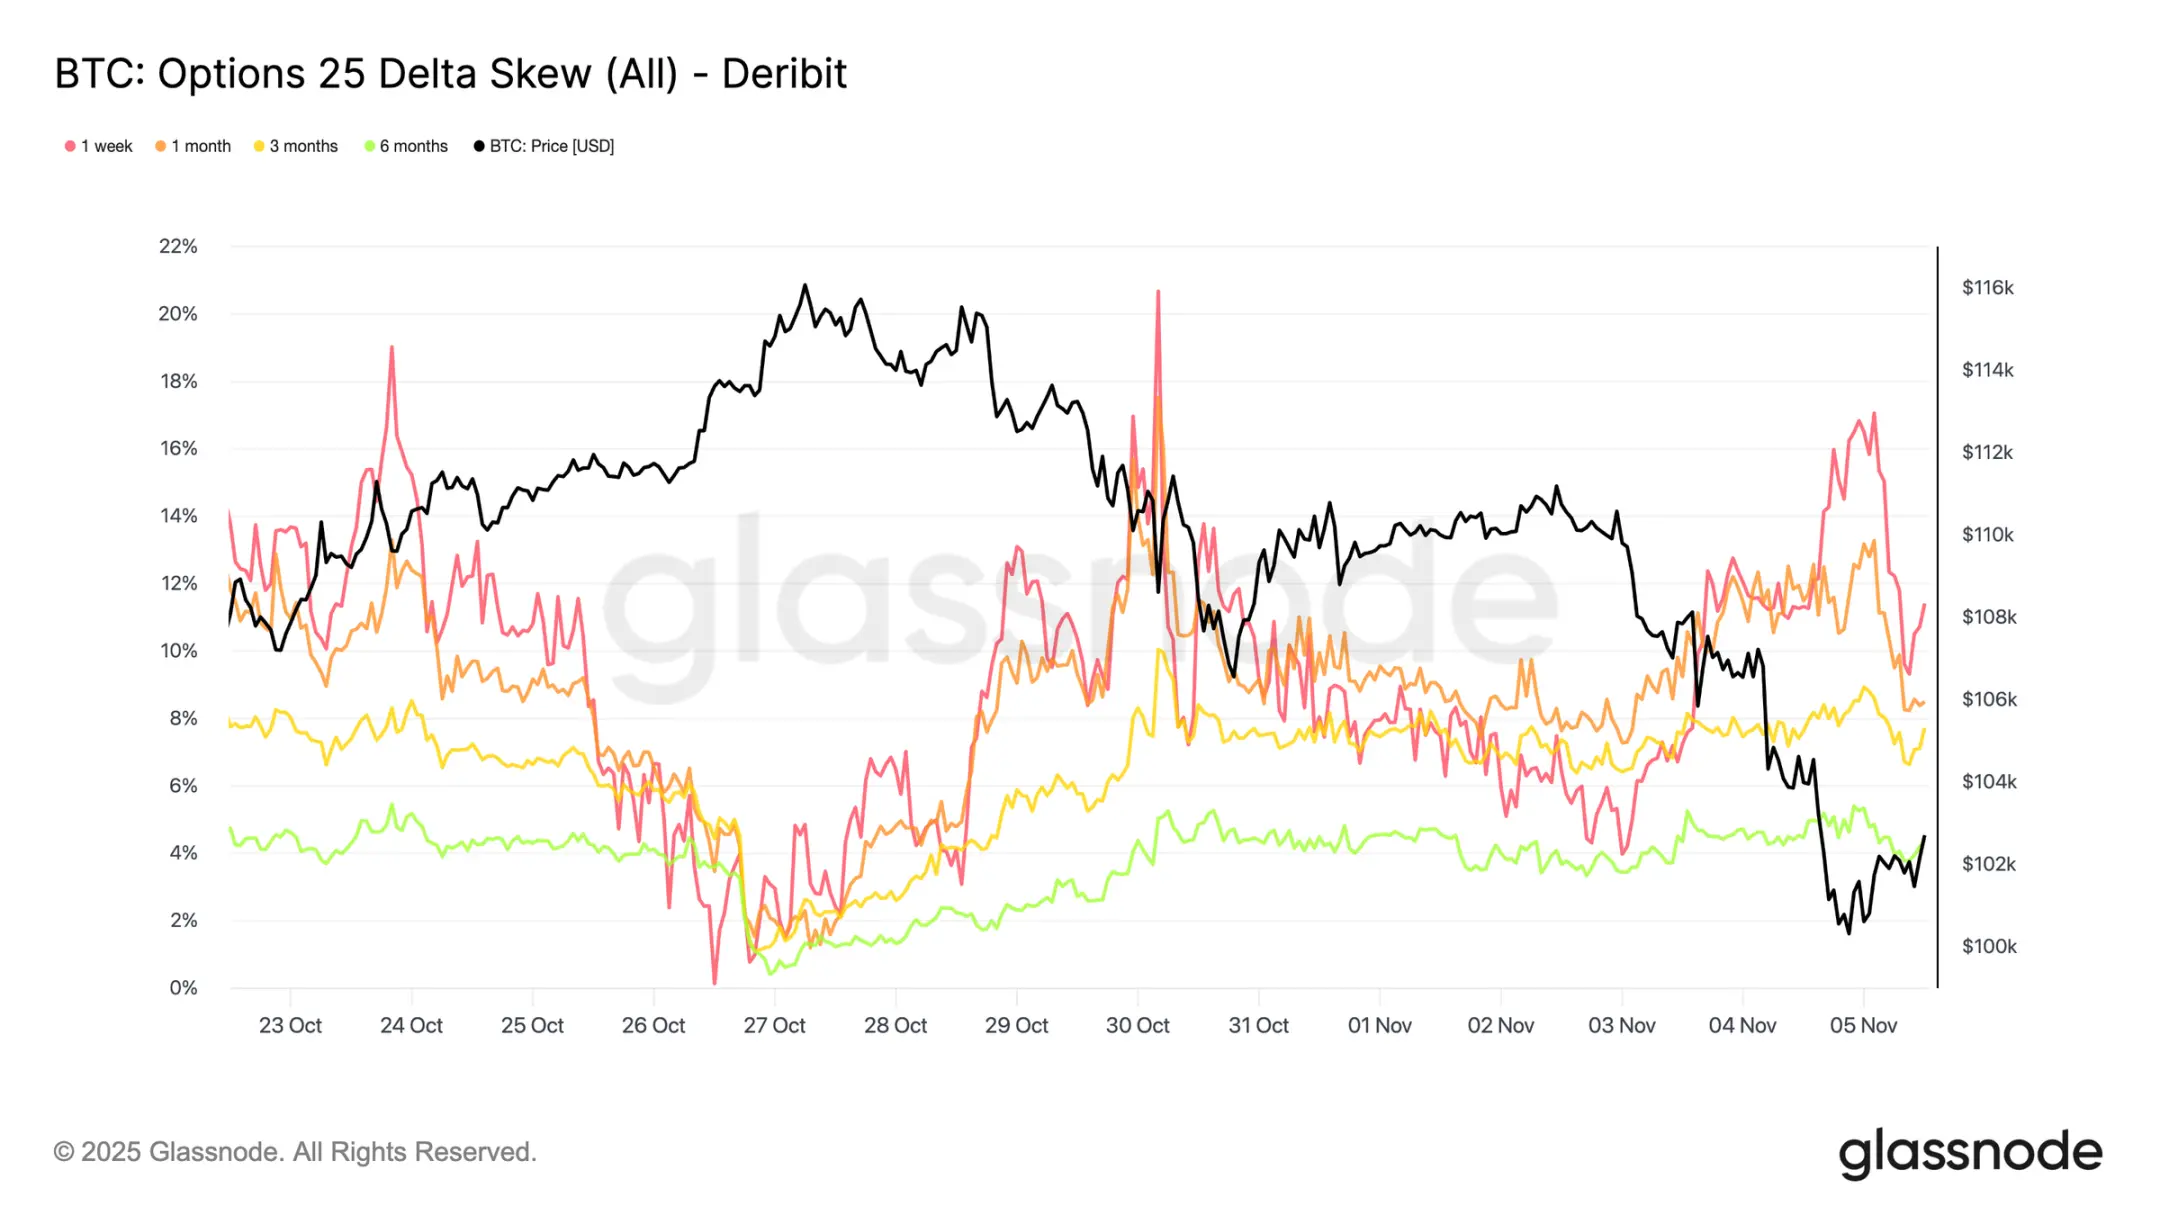
- Put option demand at the $100,000 strike is strong, with premiums rising, showing traders are still hedging risk rather than buying the dip. Short-term implied volatility remains sensitive to price swings but has stabilized after spiking in October.
- Overall, the market is in a fragile equilibrium: demand is weak, losses are manageable, and caution prevails. A sustained rebound would require renewed capital inflows and reclaiming the $112,000 - $113,000 range.
On-Chain Insights
Following last week’s report, bitcoin failed multiple attempts to reclaim the short-term holder cost basis and broke below the psychological $100,000 mark. This breakdown confirms weakened demand momentum and continued selling pressure from long-term investors, marking a clear departure from the bull market phase.
This article will assess structural market weakness using on-chain price models and spending indicators, then combine spot, perpetual, and options market data to gauge market sentiment and risk positioning for the coming week.
Testing Lower Support Levels
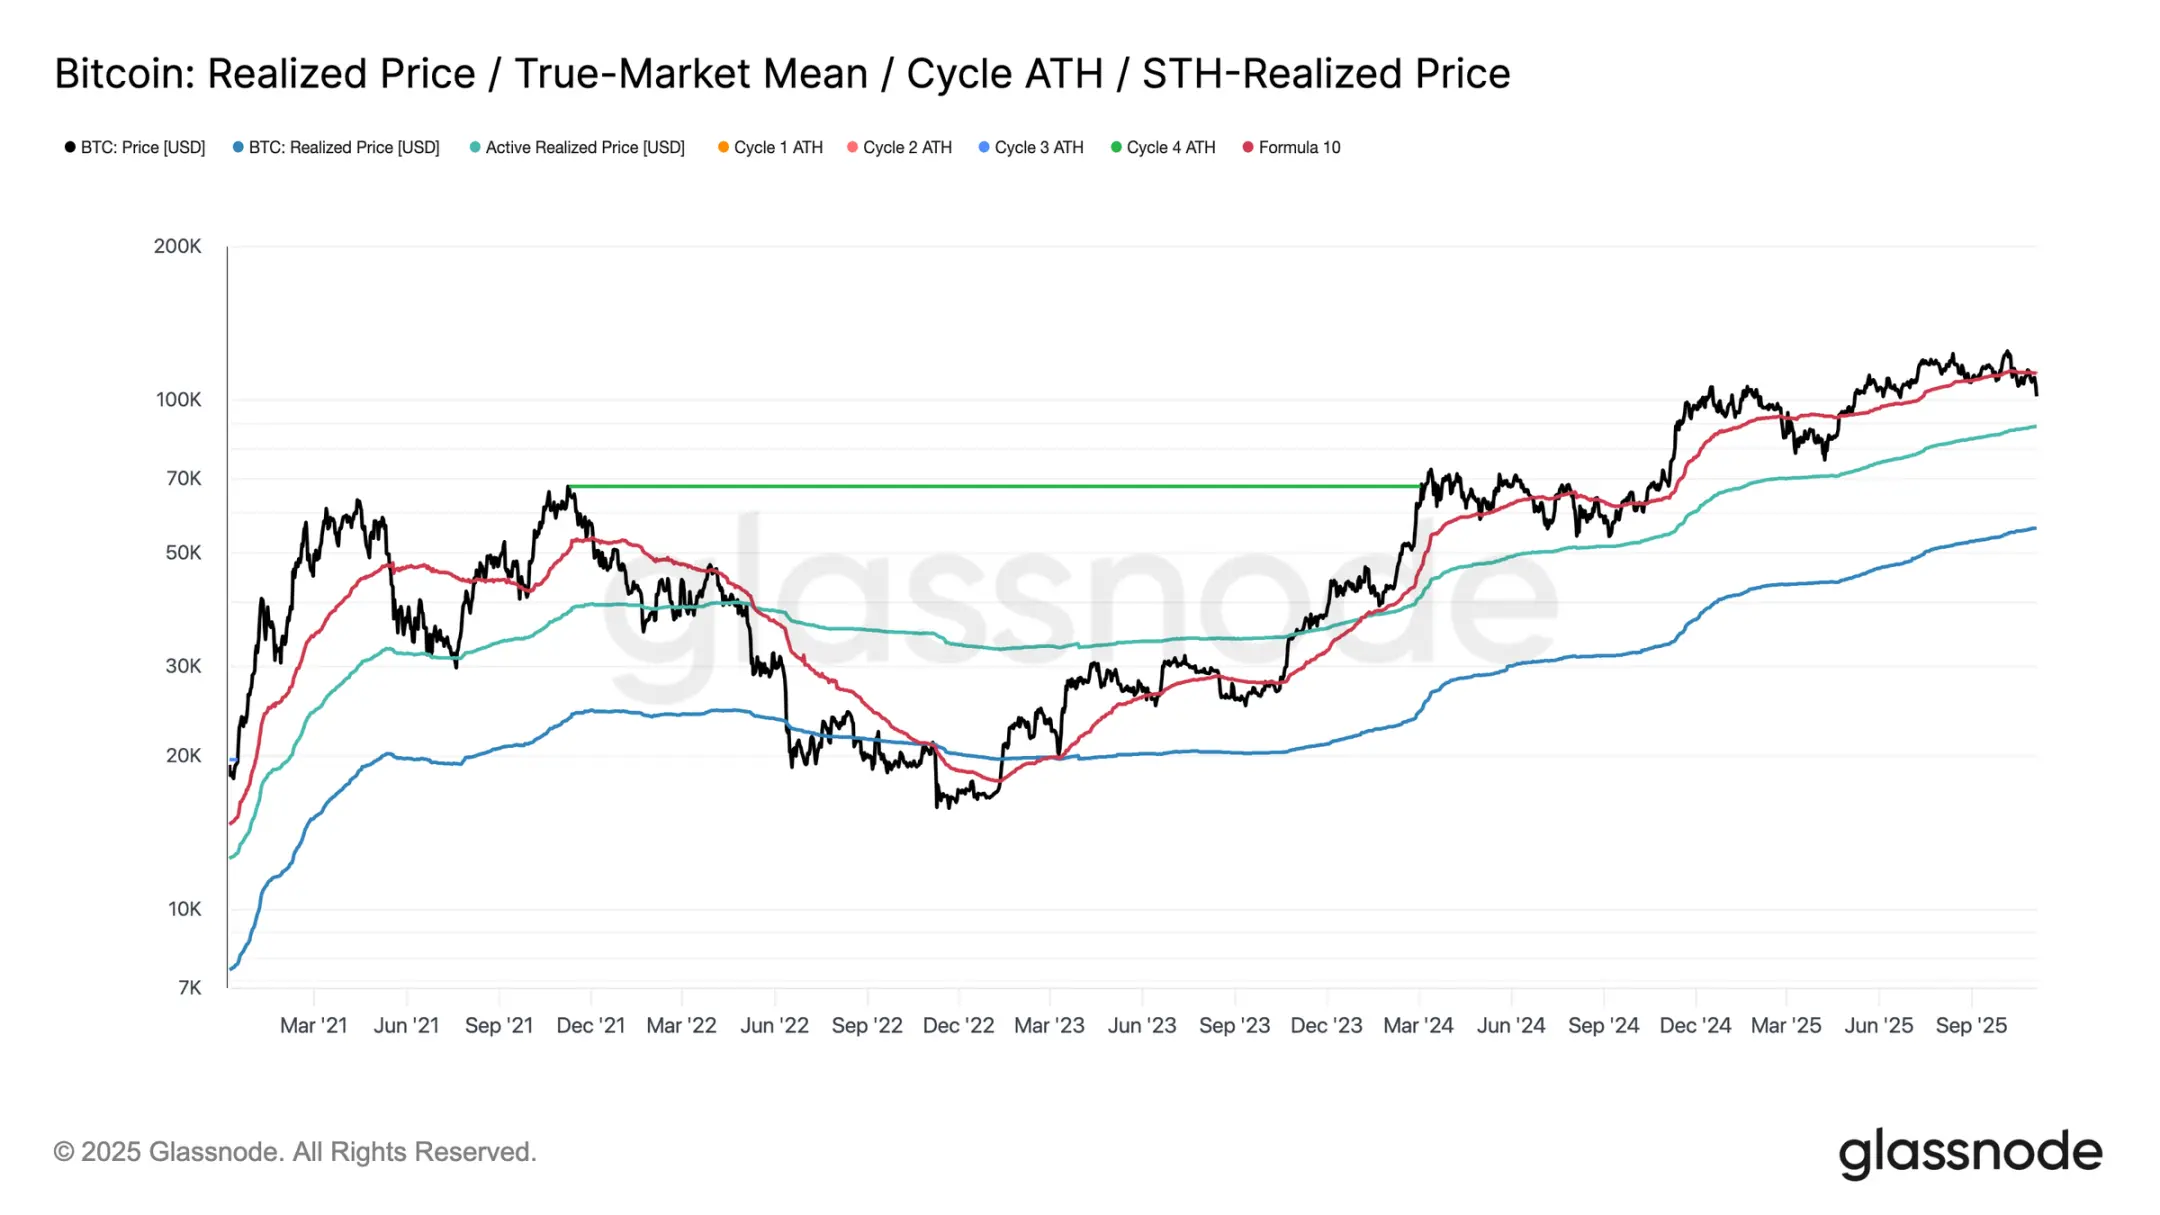
Since the sharp market drop on October 10, bitcoin has struggled to stay above the short-term holder cost basis, ultimately plunging to around $100,000—about 11% below the key $112,500 threshold.
Historically, when price trades at such a discount to this level, the likelihood of further declines to lower structural supports increases—for example, the current realized price of active investors, around $88,500. This indicator dynamically tracks the cost basis of actively circulating supply (excluding dormant coins) and has played a key reference role during prolonged correction phases in previous cycles.
At a Crossroads
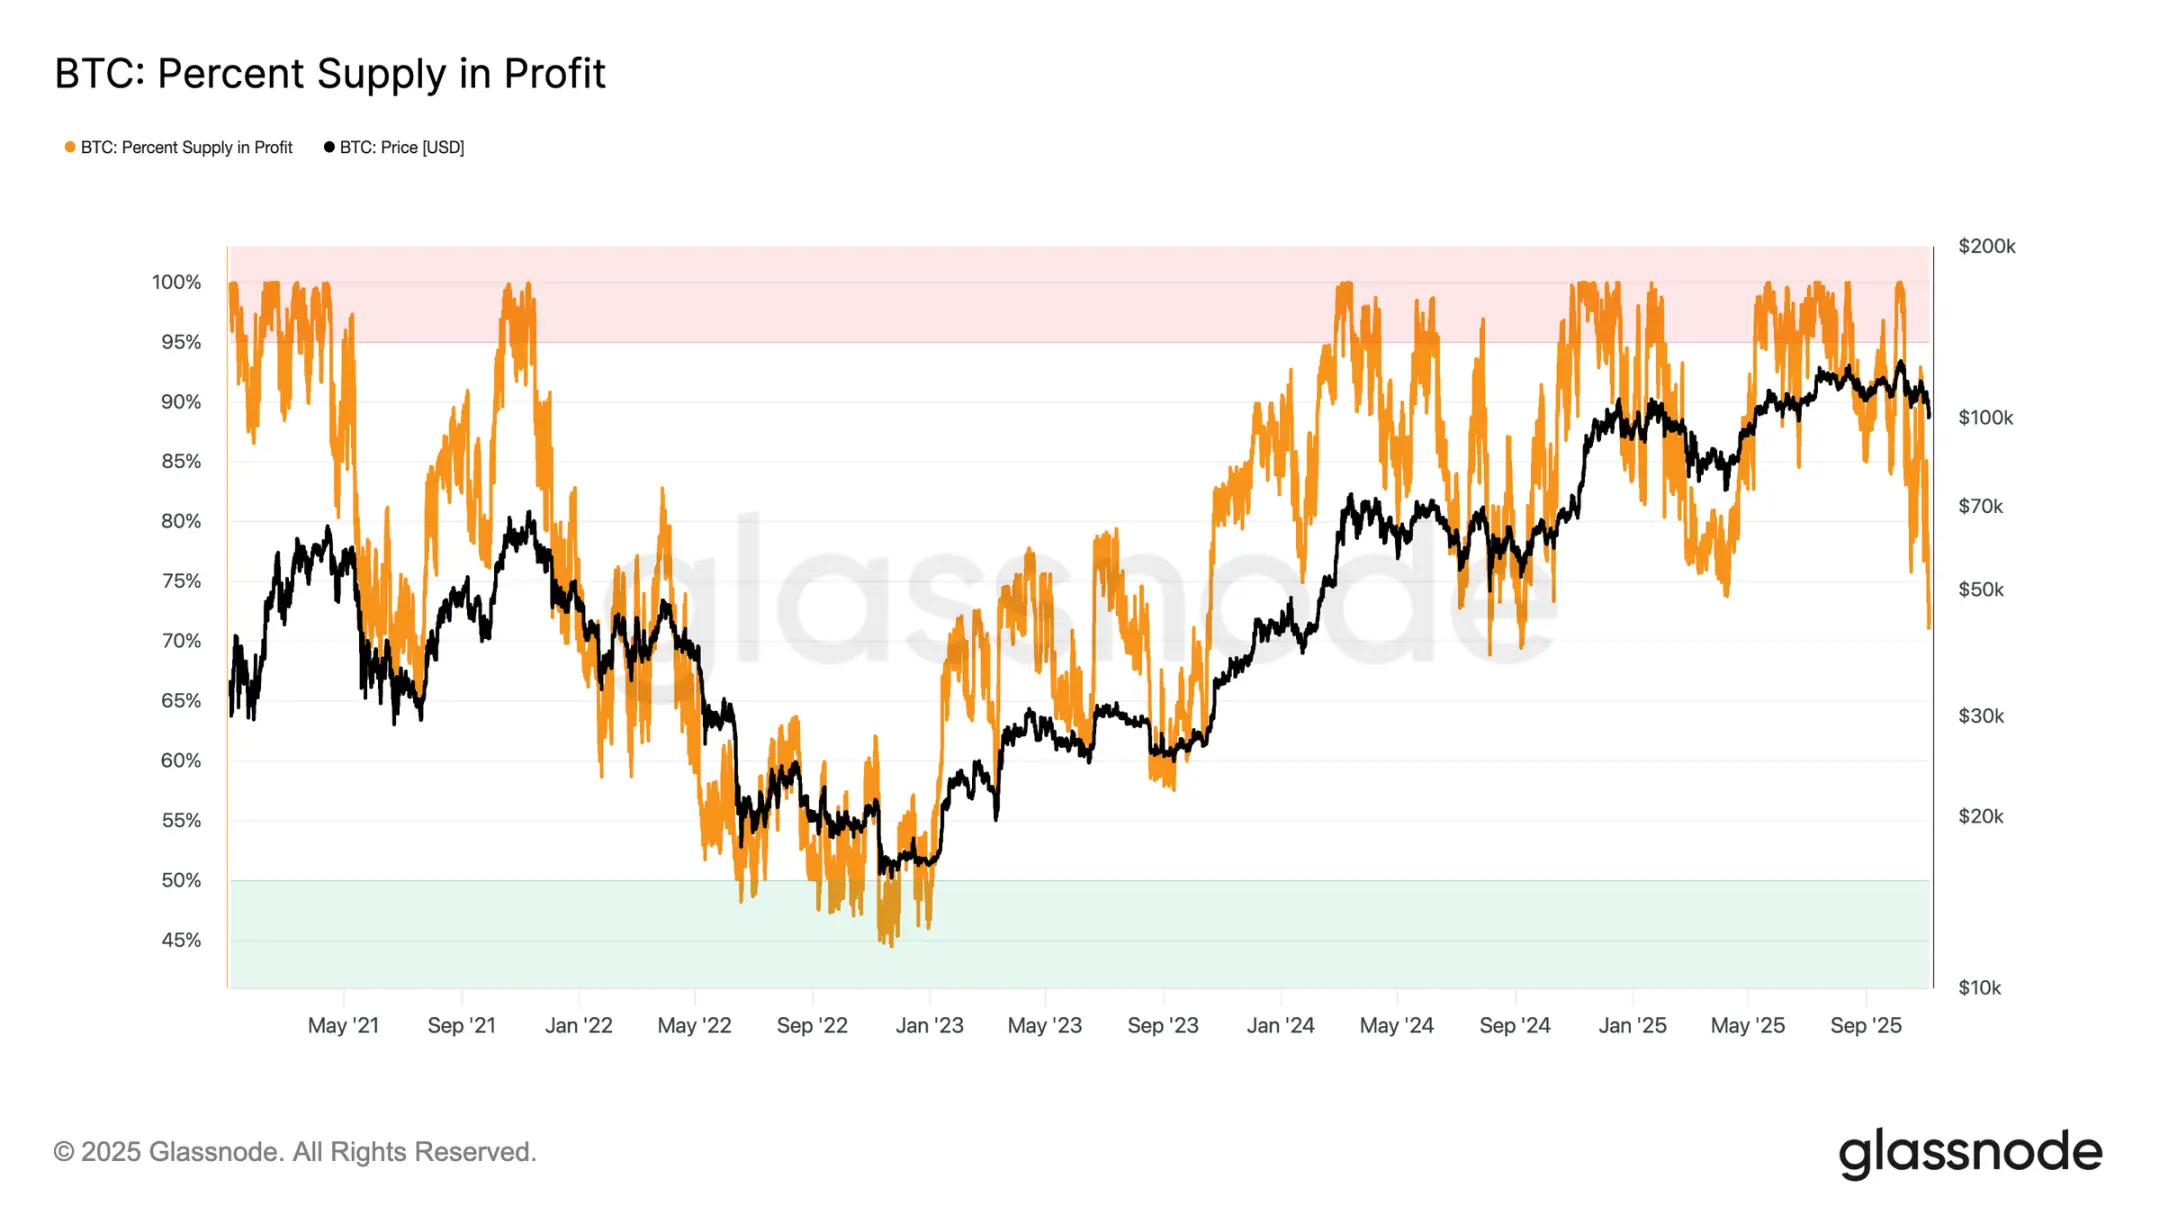
Further analysis shows that the structure of this correction is similar to June 2024 and February 2025—periods when bitcoin was at a critical crossroads between "rebound" and "deep contraction." Currently, with the price below $100,000, about 71% of supply remains in profit, placing the market at the lower end of the typical 70%-90% profitable supply equilibrium range for mid-term slowdowns.
This phase usually features brief recoveries toward the short-term holder cost basis, but sustained recovery often requires prolonged consolidation and new demand inflows. Conversely, if further weakness pushes more holders into loss, the market could transition from the current mild downturn to a deep bear phase. Historically, this stage is characterized by capitulation selling and long-term reaccumulation.
Losses Remain Manageable
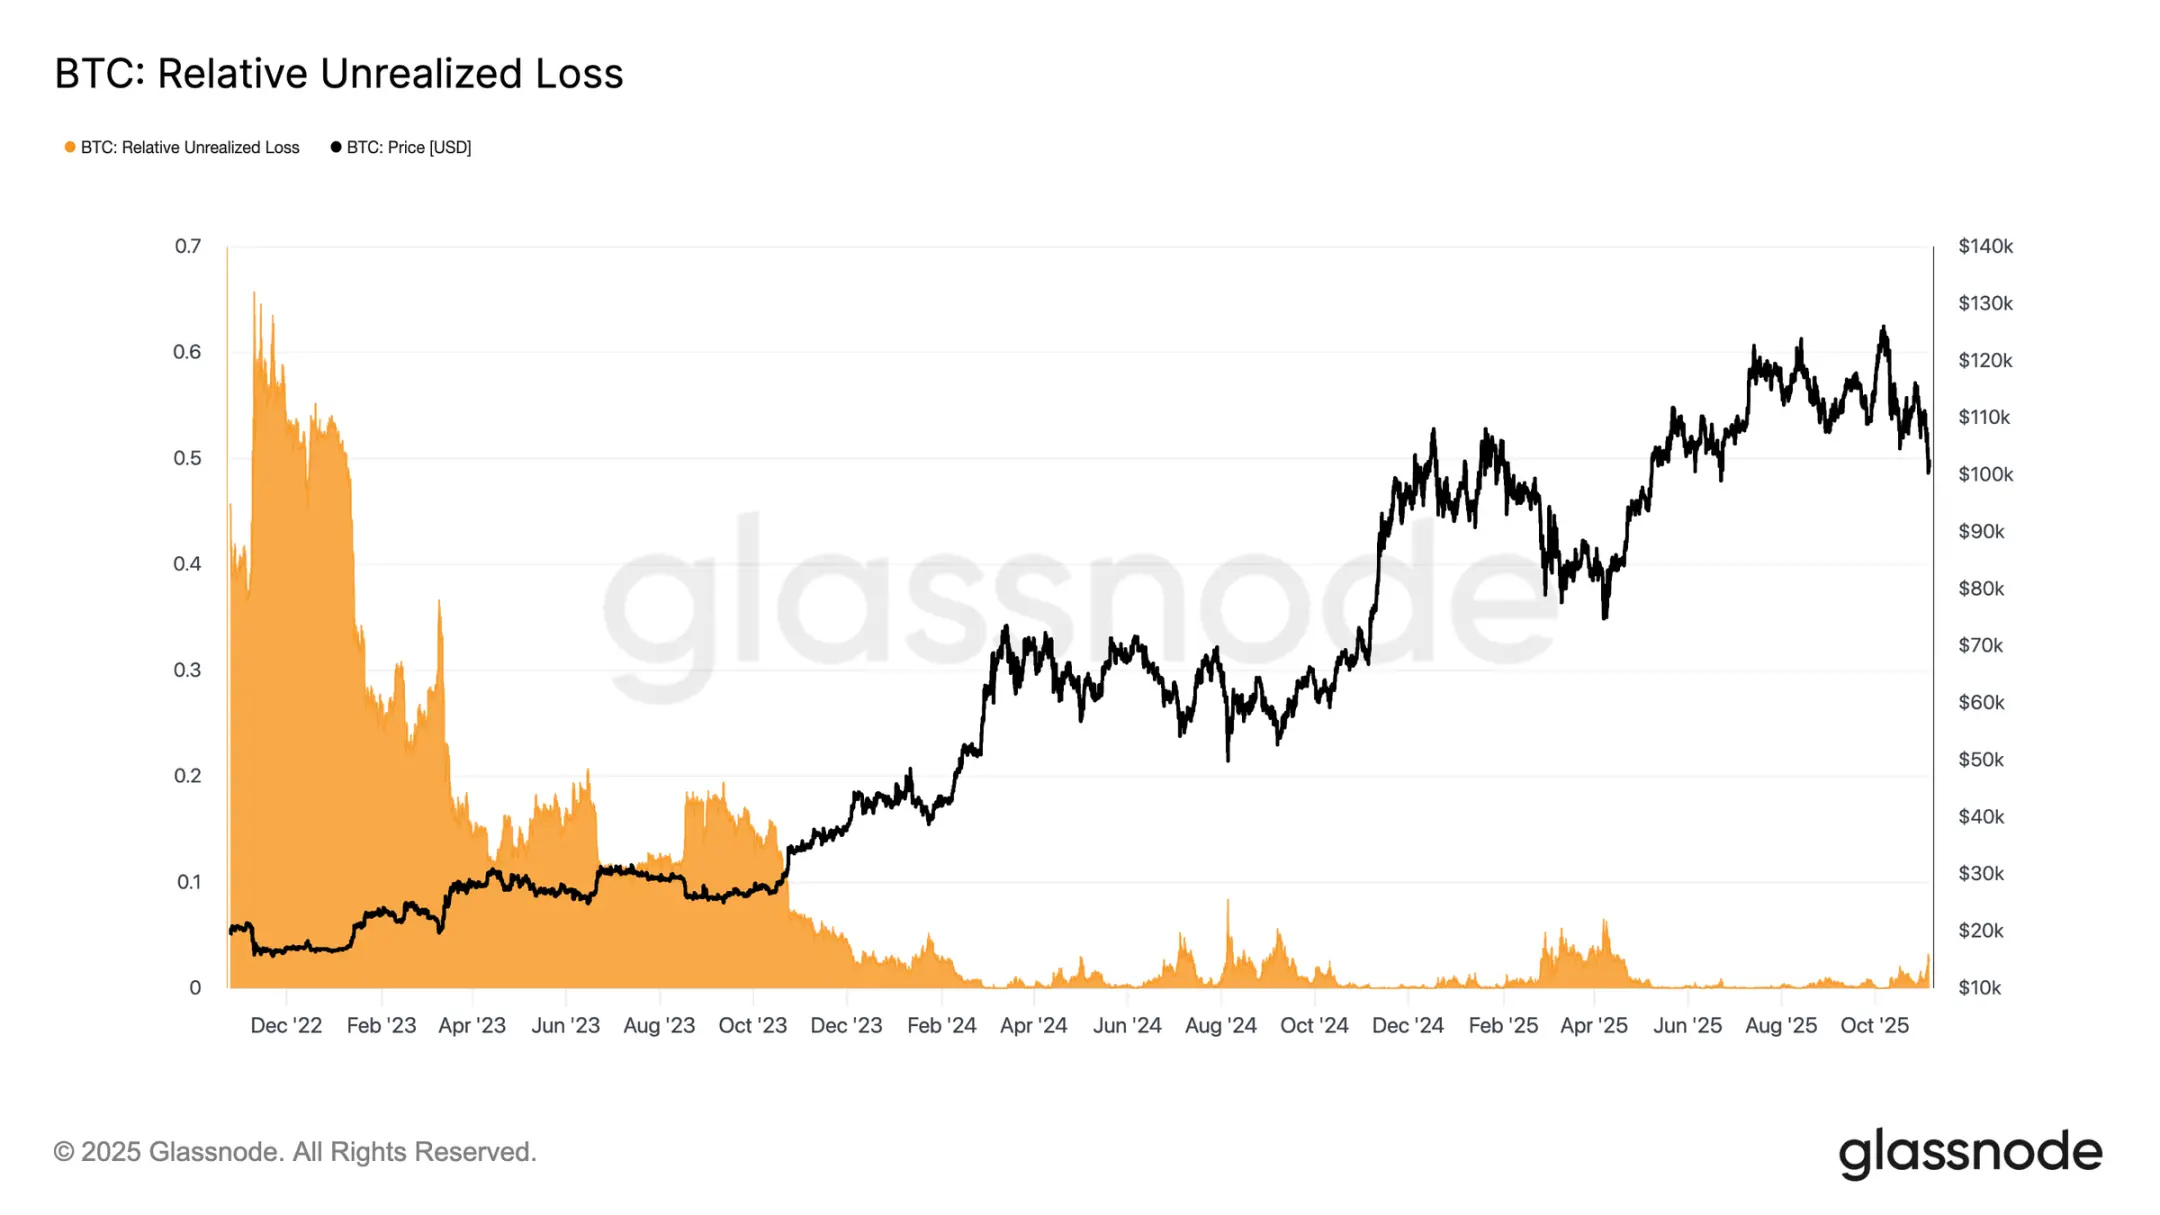
To further distinguish the nature of the current pullback, the relative unrealized loss rate can be referenced—this metric measures the proportion of total unrealized losses (in USD) to market cap. Unlike the extreme loss levels of the 2022-2023 bear market, the current 3.1% unrealized loss rate indicates mild market stress, comparable to the mid-term corrections of Q3/Q4 2024 and Q2 2025, and remains below the 5% threshold.
As long as the unrealized loss rate stays in this range, the market can be classified as a "mild bear," characterized by orderly repricing rather than panic selling. However, if the pullback intensifies and this ratio exceeds 10%, widespread capitulation selling could be triggered, marking a shift to a more severe bear market regime.
Long-Term Holders Continue to Sell
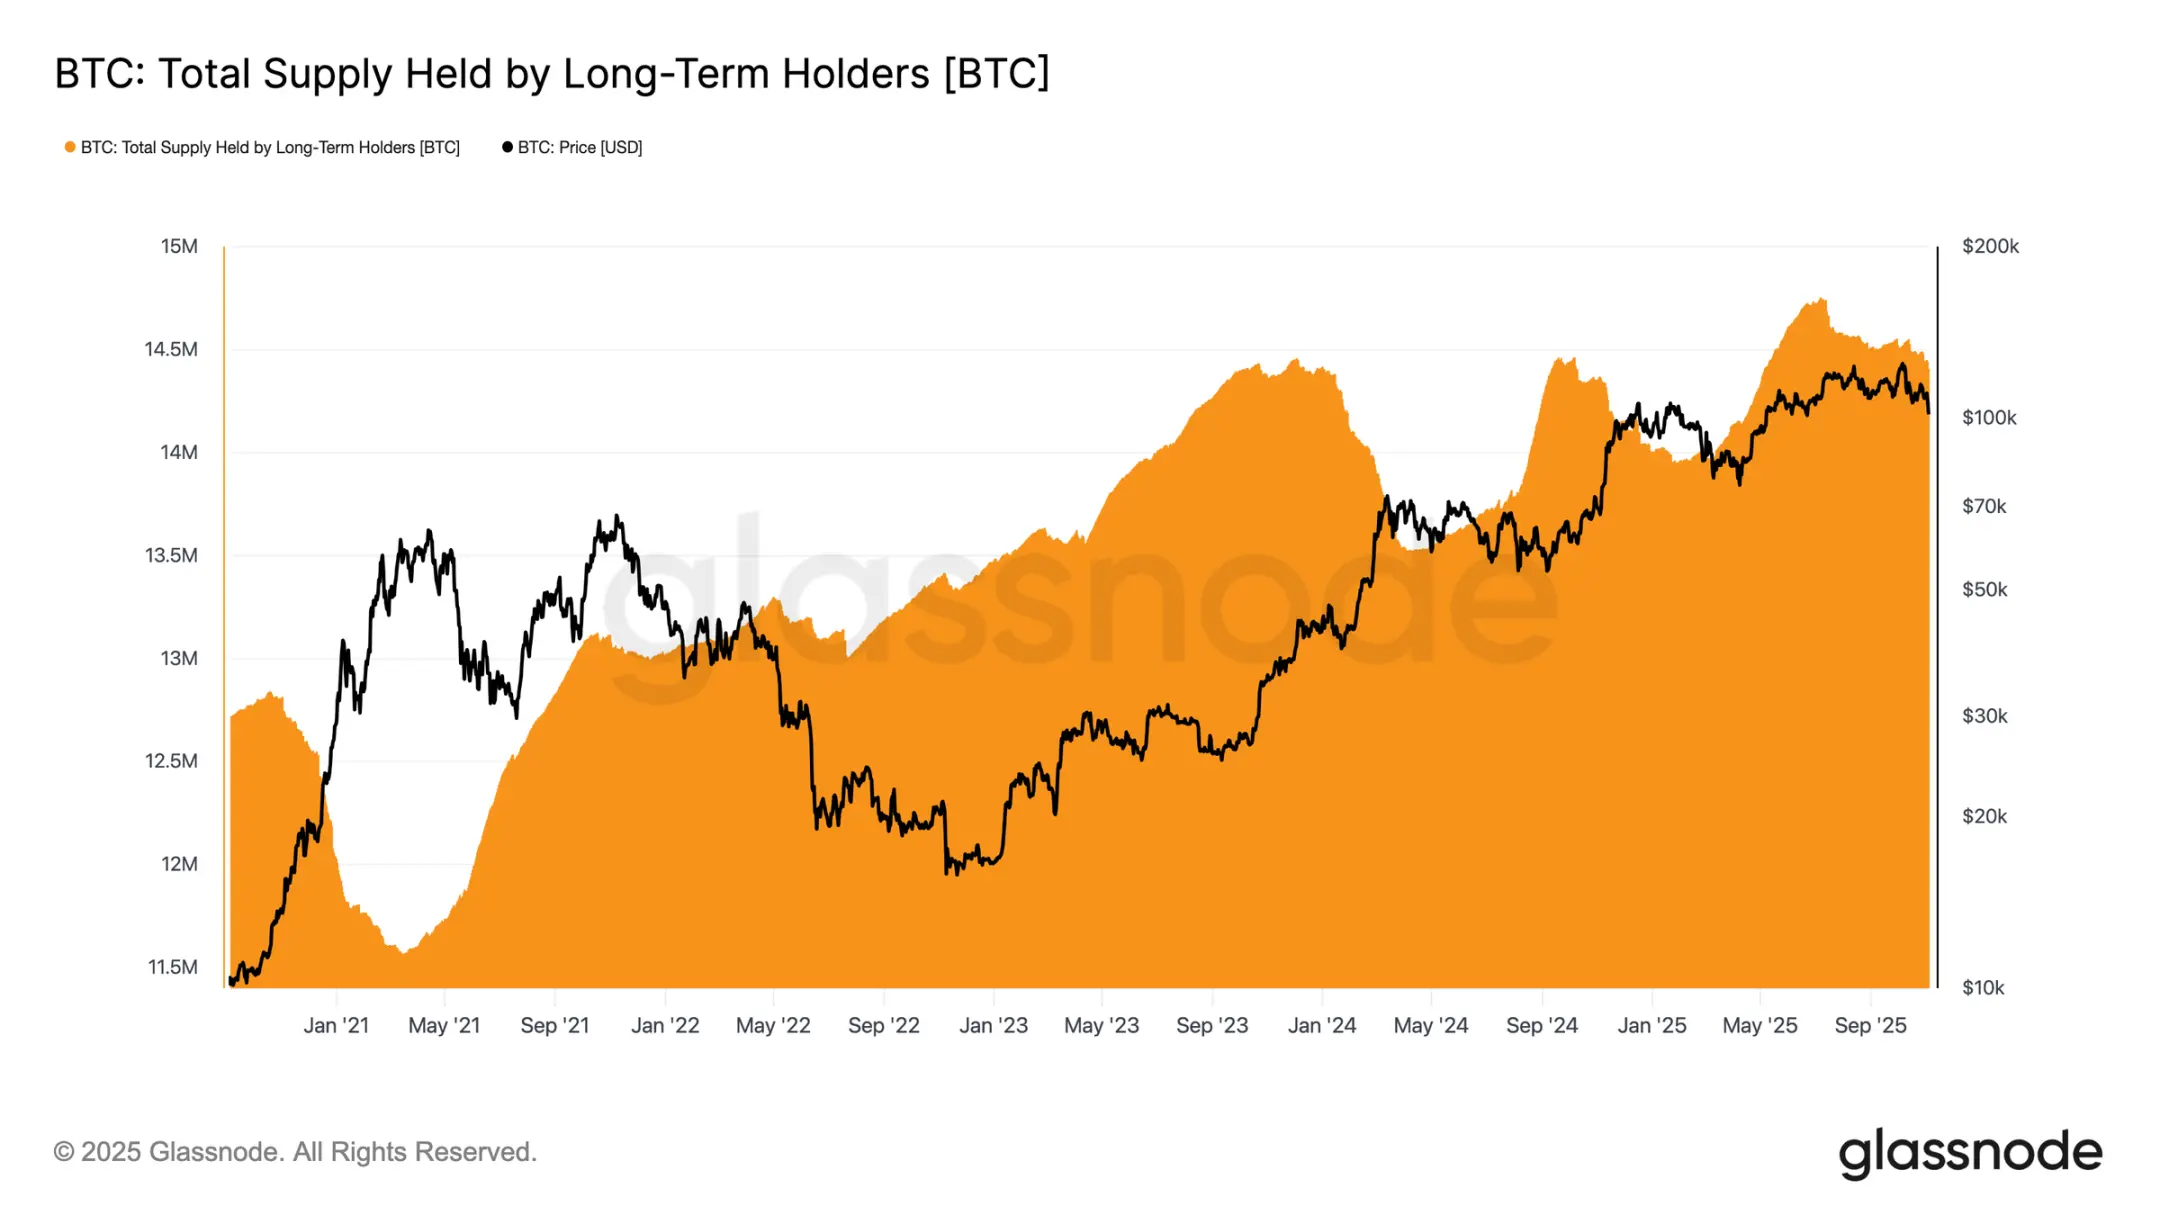
Although losses are relatively manageable and the market is only down 21% from the $126,000 ATH, there is still moderate but persistent selling pressure from long-term holders (LTH). This trend has gradually emerged since July 2025, and even the new highs in early October did not change this, surprising many investors.
During this period, long-term holders’ bitcoin holdings decreased by about 300,000 coins (from 14.7 million to 14.4 million). Unlike the early cycle selling wave—when long-term holders sold into sharp rallies—this time they are "selling into weakness," reducing holdings as prices consolidate and decline. This behavioral shift suggests seasoned investors are showing deeper fatigue and declining confidence.
Off-Chain Insights
Running Low on Ammo: Institutional Demand Cools
Turning to institutional demand: over the past two weeks, U.S. spot bitcoin ETF inflows have slowed significantly, with persistent net outflows of $150 million - $700 million daily. This contrasts sharply with the strong inflows from September to early October, which provided price support.
Recent trends indicate that institutional capital allocation has become more cautious, with profit-taking and reduced willingness to add exposure dragging down overall ETF buying pressure. This cooling activity is closely tied to overall price weakness, highlighting a decline in buyer confidence after months of accumulation.
Clear Bias: Weak Spot Demand
Over the past month, spot market activity has continued to weaken, with cumulative volume delta (CVD) on major exchanges trending downward. Both Binance and overall spot CVD have turned negative, at -822 BTC and -917 BTC respectively, indicating persistent selling pressure and limited active buying. Coinbase is relatively neutral, with a CVD of +170 BTC, showing no clear signs of buyer absorption.
The deterioration in spot demand mirrors the slowdown in ETF inflows, indicating declining confidence among self-directed investors. These signals collectively reinforce the cooling market tone: buying interest is subdued, and rebound rallies are quickly met with profit-taking.
Interest Fades: Derivatives Market Deleveraging
In the derivatives market, the directional premium in perpetual contracts (the fee paid by long traders to maintain positions) has dropped sharply from a peak of $338 million per month in April to about $118 million. This significant decline signals widespread closing of speculative positions and a clear cooling of risk appetite.
After a sustained period of high positive funding rates mid-year, the steady decline in this metric shows traders are reducing directional leverage, favoring neutrality over aggressive long exposure. This shift aligns with the overall weakness in spot demand and ETF inflows, highlighting that the perpetual market has shifted from optimism to a more cautious risk-averse stance.
Seeking Protection: Defensive Tone in the Options Market
As bitcoin hovers near the $100,000 psychological level, options skew unsurprisingly shows strong demand for puts. Data indicates the options market is not betting on a reversal or "buying the dip," but is instead paying high premiums to guard against further downside risk. Put option prices at key support levels are elevated, showing traders remain focused on risk protection rather than accumulating positions. In short, the market is hedging, not bottom-fishing.
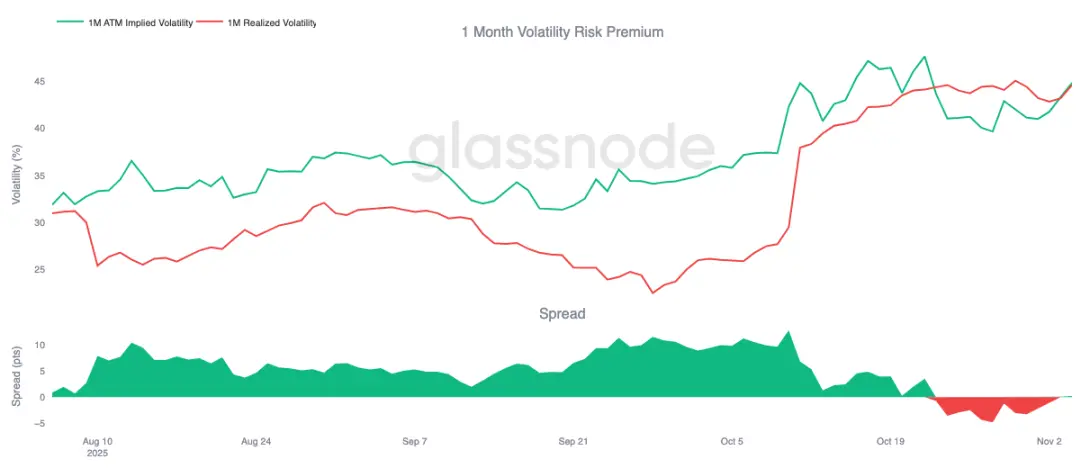
Risk Premium Rebounds
After ten consecutive days in negative territory, the one-month volatility risk premium has turned slightly positive. As expected, this premium mean-reverted—after a tough period for gamma sellers, implied volatility has been repriced higher.
This shift reflects that caution still dominates the market. Traders are willing to pay up for protection, allowing market makers to take the other side. Notably, as bitcoin fell to $100,000, implied volatility rose in tandem with the rebuilding of defensive positions.
Volatility Spikes and Pulls Back
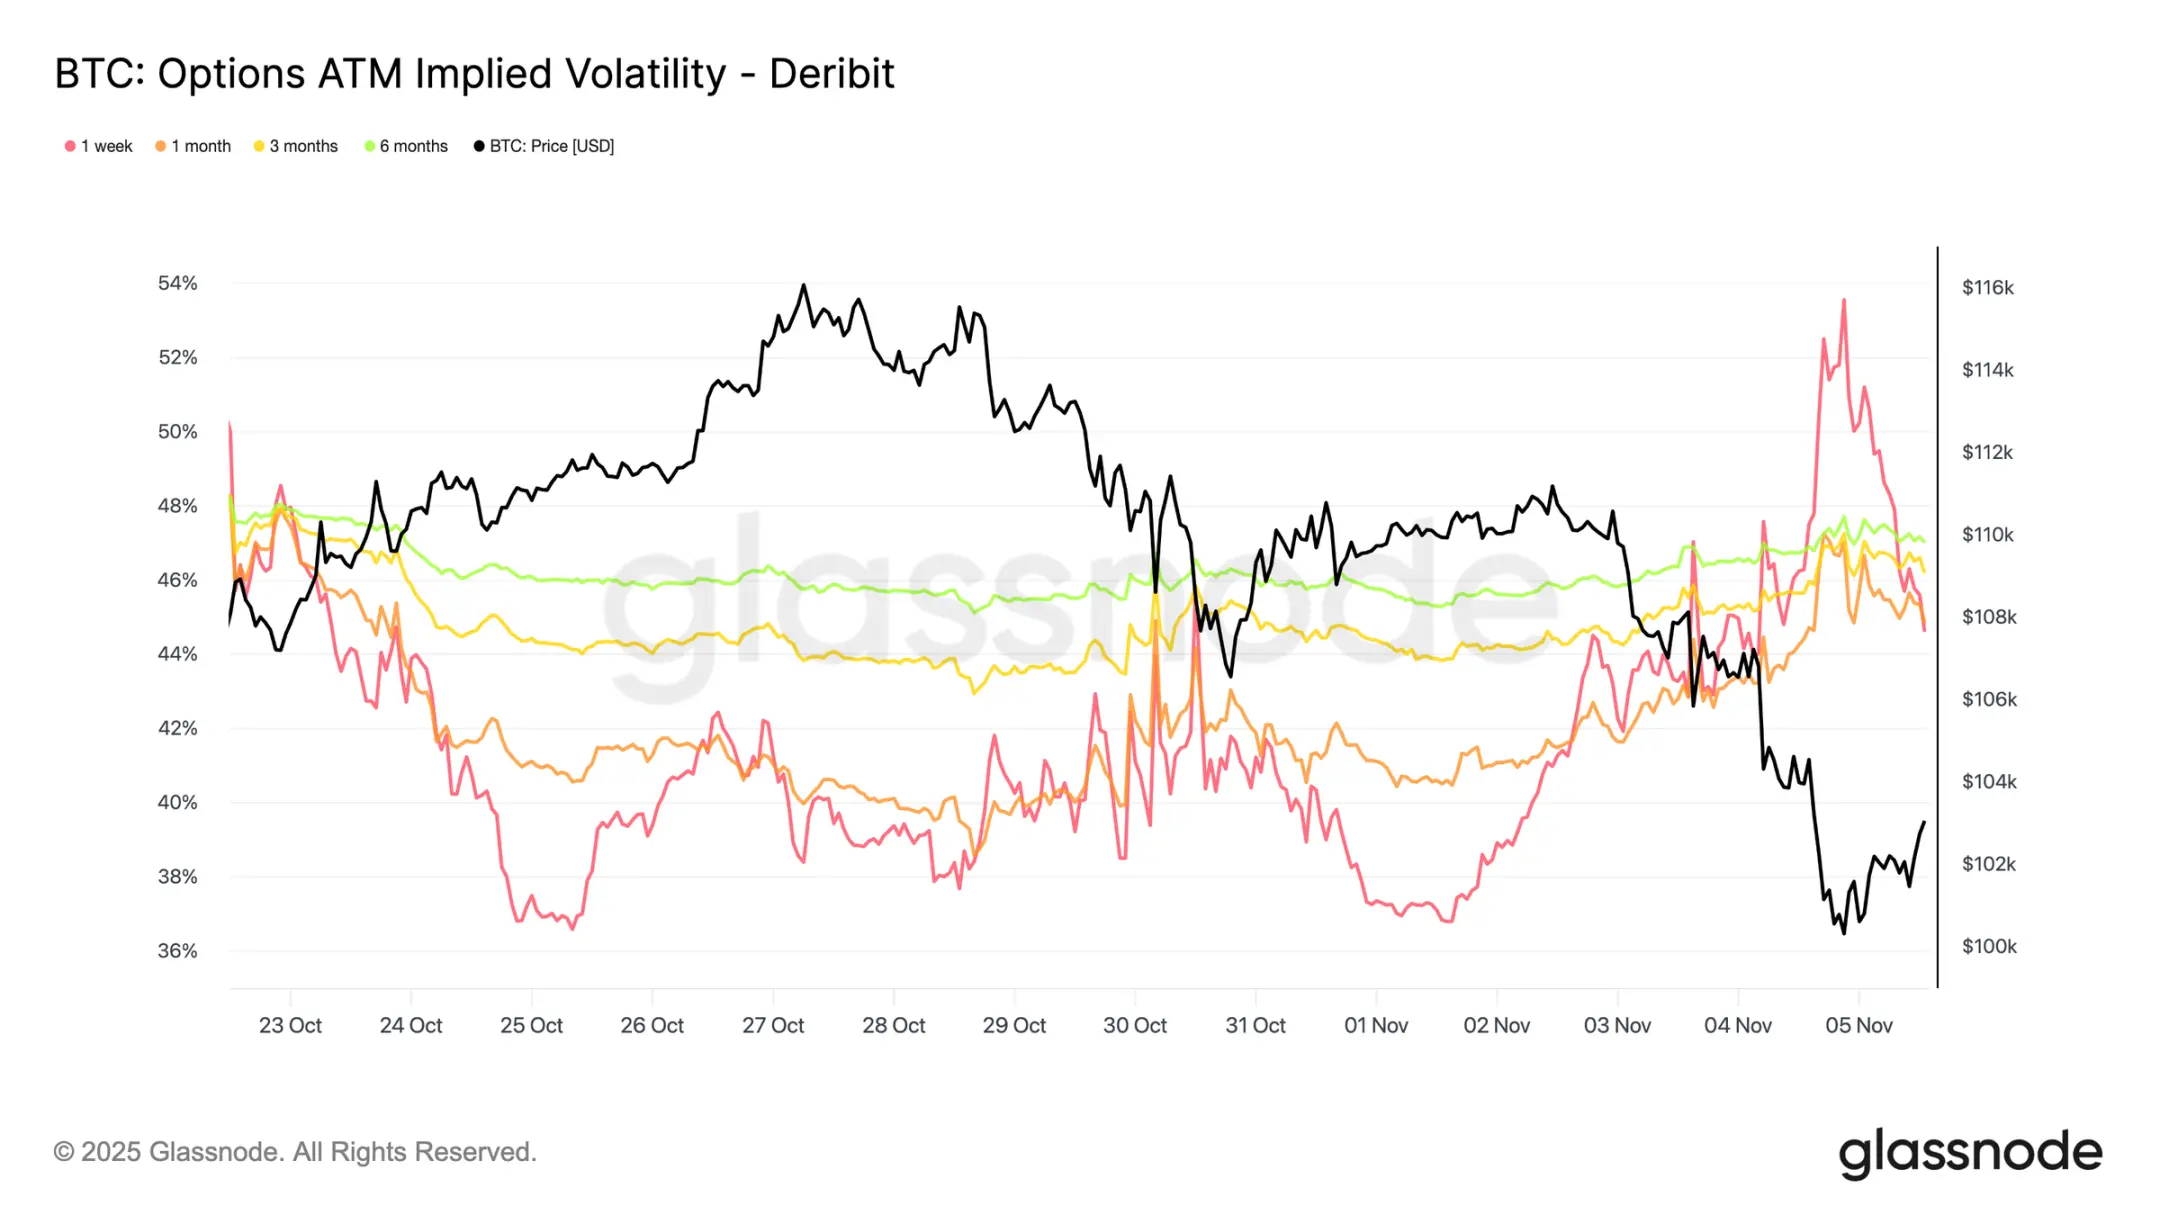
Short-term implied volatility remains closely and negatively correlated with price action. During bitcoin sell-offs, volatility spiked sharply, with one-week implied volatility reaching 54%, then falling back by about 10 volatility points after finding support near $100,000.
Longer-dated volatility also rose: one-month volatility increased by about 4 points from pre-correction levels near $110,000, and six-month volatility rose by about 1.5 points. This pattern highlights the classic "panic-volatility" relationship, where rapid price drops still drive short-term volatility surges.
The Defense of the $100,000 Level
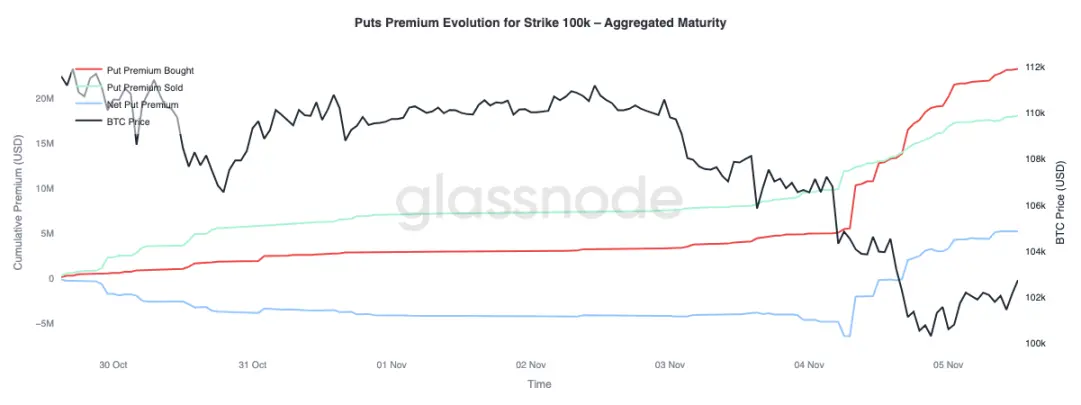
Observing the put option premium at the $100,000 strike provides further insight into current sentiment. Over the past two weeks, net put premium has gradually risen, and yesterday, as concerns about the end of the bull market intensified, premiums spiked sharply. During the sell-off, put premiums surged, and even as bitcoin stabilized near support, premiums remained elevated. This trend confirms ongoing hedging activity, with traders still opting for protection rather than re-risking.
Defensive Capital Flows
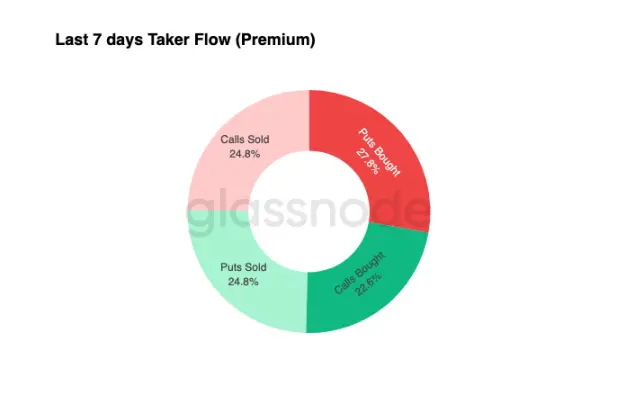
Capital flow data over the past seven days shows that aggressive trades are mainly negative delta positions—primarily through buying puts and selling calls. In the past 24 hours, there are still no clear bottoming signals. Market makers remain long gamma, absorbing significant risk from yield-seeking traders and may profit from two-way price swings.
This pattern keeps volatility high but manageable, and the market maintains a cautious tone. Overall, the current environment favors defense over aggressive risk-taking, lacking clear upside catalysts. However, as downside protection remains expensive, some traders may soon start selling risk premium to seek value opportunities.
Conclusion
Bitcoin’s drop below the short-term holder cost basis (around $112,500) and stabilization near $100,000 marks a decisive structural shift in the market. So far, this correction resembles previous mid-term slowdowns: 71% (within the 70%-90% range) of supply remains in profit, and the relative unrealized loss rate is contained at 3.1% (below 5%), indicating a mild bear market rather than deep capitulation. However, persistent long-term holder selling since July and ETF outflows highlight weakening confidence among both retail and institutional investors.
If selling pressure continues, the realized price of active investors (around $88,500) will be a key downside reference; reclaiming the short-term holder cost basis would signal renewed demand strength. Meanwhile, directional premium in the perpetual market and CVD bias both indicate a retreat in speculative leverage and declining spot participation, reinforcing a risk-averse environment.
In the options market, strong put demand, rising $100,000 strike premiums, and a modest rebound in implied volatility all confirm a defensive tone. Traders still prioritize protection over accumulation, reflecting hesitation about a "bottom."
Overall, the market is in a fragile equilibrium: oversold but not panicked, cautious but structurally intact. The next directional move will depend on whether new demand can absorb persistent long-term holder selling and reclaim the $112,000 - $113,000 range as solid support, or if sellers continue to dominate and extend the current downtrend.
Disclaimer: The content of this article solely reflects the author's opinion and does not represent the platform in any capacity. This article is not intended to serve as a reference for making investment decisions.
You may also like
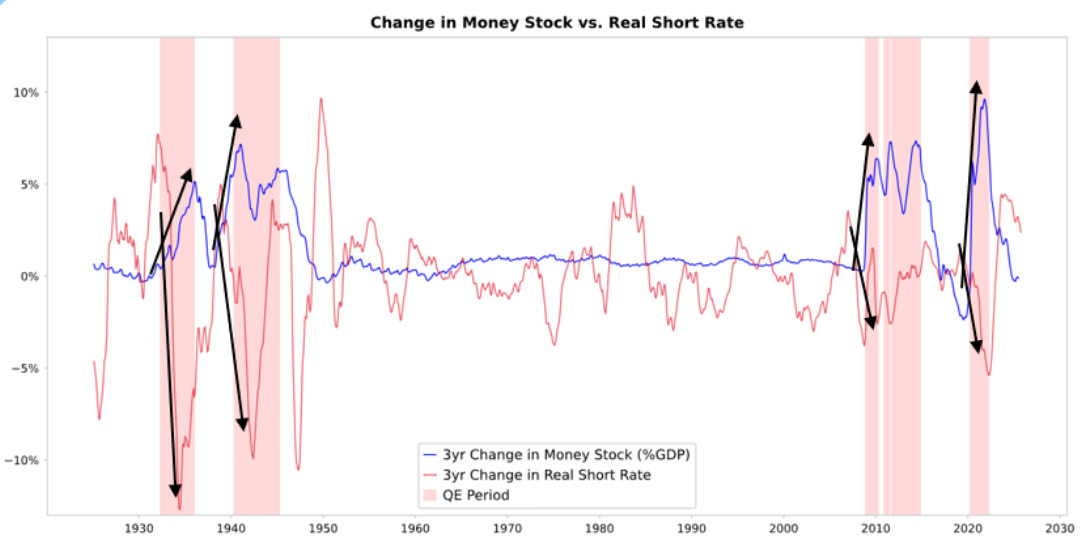
Ray Dalio's latest article: This time is different, the Federal Reserve is fueling a bubble
Due to the highly stimulative nature of current government fiscal policies, quantitative easing will effectively monetize government debt rather than simply reinjecting liquidity into the private system.

Latest! Polkadot updates its 2025 roadmap, with several core products set to launch soon!

"I'm not good at management" — Gavin Wood's choice is also Polkadot's opportunity!
