Bitget App
Trade smarter
Buy cryptoMarketsTradeFuturesEarnWeb3SquareMore
Trade
Spot
Buy and sell crypto with ease
Margin
Amplify your capital and maximize fund efficiency
Onchain
Going Onchain, without going Onchain!
Convert & block trade
Convert crypto with one click and zero fees
Explore
Launchhub
Gain the edge early and start winning
Copy
Copy elite trader with one click
Bots
Simple, fast, and reliable AI trading bot
Trade
USDT-M Futures
Futures settled in USDT
USDC-M Futures
Futures settled in USDC
Coin-M Futures
Futures settled in cryptocurrencies
Explore
Futures guide
A beginner-to-advanced journey in futures trading
Futures promotions
Generous rewards await
Overview
A variety of products to grow your assets
Simple Earn
Deposit and withdraw anytime to earn flexible returns with zero risk
On-chain Earn
Earn profits daily without risking principal
Structured Earn
Robust financial innovation to navigate market swings
VIP and Wealth Management
Premium services for smart wealth management
Loans
Flexible borrowing with high fund security
Polkadot (DOT) Flashes Potential Bullish Reversal Setup – Will It Rally Higher?

Polkadot (DOT) Flashes Potential Bullish Reversal Setup – Will It Rally Higher?

CoinsProbeCoinsProbe2025/11/07 15:00
By:Nilesh Hembade

Date: Fri, Nov 07, 2025 | 08:50 AM GMT

The cryptocurrency market continues to highlight strong performance among long-standing altcoins. Internet Computer (ICP) has already surged by more than 200% in just one week, and now attention is shifting toward another established project — Polkadot (DOT).

DOT has gained 8% today, and more importantly, its chart is beginning to show signs of a potential “Power of 3” (PO3) reversal pattern — a structure that often appears near major market bottoms and signals a possible trend shift.

Polkadot (DOT) Flashes Potential Bullish Reversal Setup – Will It Rally Higher? image 0 Source: Coinmarketcap

Power of 3 Pattern in Play

On the daily chart, DOT’s recent price movement aligns with the key stages of the PO3 model, which typically includes accumulation, manipulation, and expansion.

Accumulation Phase

From March to October, DOT consolidated within a wide range, with resistance near $4.70 and support around $3.36. This prolonged sideways action suggests that larger players may have been quietly accumulating positions while volatility remained low.

Manipulation Phase

On 10 October, DOT broke below the $3.36 support level and dropped sharply to $2.34 before recovering. This move below the established range forms the manipulation phase of the PO3 structure, where weaker hands are shaken out before a potential bullish leg begins.

Polkadot (DOT) Flashes Potential Bullish Reversal Setup – Will It Rally Higher? image 1 
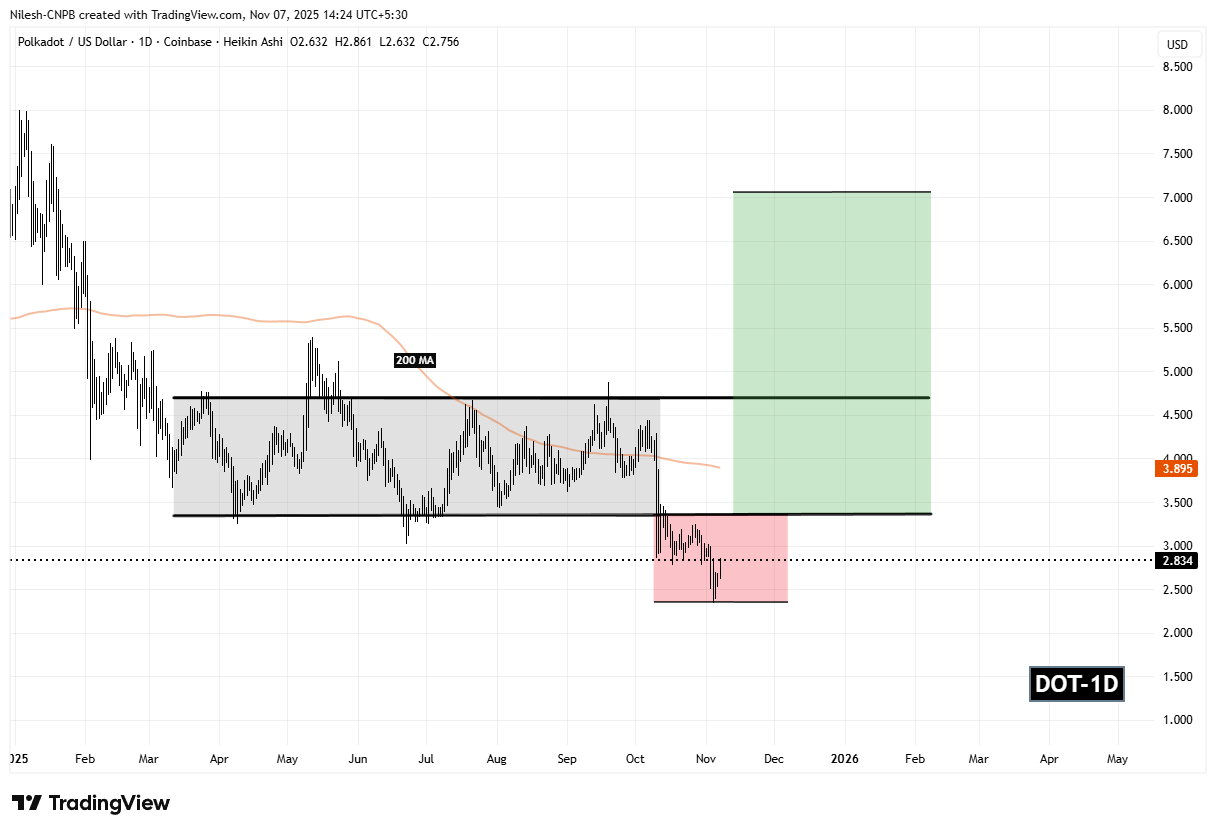
Polkadot (DOT) Daily Chart/Coinsprobe (Source: Tradingview)

DOT is now trading around $2.83, still within the manipulation zone highlighted on the chart.

What’s Next for DOT?

DOT remains in the manipulation phase, meaning short-term volatility is still likely. However, the next decisive levels will determine whether the expansion phase of the PO3 pattern takes shape.

Key levels to watch:

  • Reclaiming $3.89 (200-day Moving Average) would indicate a shift in momentum.
  • A breakout above $4.70 resistance would confirm the expansion phase.

If DOT successfully breaks above $4.70, it could trigger a strong move toward the $7.06 target zone, representing a potential 150 percent rise from the recent low.

DOT’s current structure is showing early signs of a possible reversal. While confirmation is still needed, the developing PO3 pattern suggests that Polkadot may be preparing for a significant upward trend if buyers continue to show strength and reclaim key resistance levels.

0

Disclaimer: The content of this article solely reflects the author's opinion and does not represent the platform in any capacity. This article is not intended to serve as a reference for making investment decisions.

PoolX: Earn new token airdrops
Lock your assets and earn 10%+ APR
Lock now!

You may also like

YFI rises 6.35% amid robust short-term performance

- YFI surged 6.35% in 24 hours on Nov 7, 2025, with 8.24% weekly and 7.99% 30-day gains despite a 36.4% annual decline. - Analysts attribute the rally to strong market sentiment and crypto sector dynamics, not specific project announcements or technical updates. - Technical indicators show a bullish reversal pattern, suggesting renewed investor confidence or algorithmic trading activity. - A proposed backtesting strategy tests buying after 5% daily gains, holding for three days to capture upward trend cont

Bitget-RWA2025/11/07 18:02

Bitget Transforms Capital Movement by Integrating Conventional and Digital Markets

- Bitget launches $2M interest-free loan program for altcoin market makers, slashing qualification requirements by 50% to boost liquidity in smaller-cap tokens. - The exchange partners with Fasanara Capital to pioneer hybrid liquidity models, merging blockchain and institutional finance for real-time cross-border capital flow. - Bitget slashes stock futures fees by 90%, attracting $300M+ daily volume and surpassing $1B cumulative trading since September 2025 launch. - Through multi-chain integration and 20

Bitget-RWA2025/11/07 17:44

Zcash Halving and Its Impact on the Market: Price Movements After Halving and Investor Sentiment

- Zcash's 2025 halving triggered a 750% price surge to $400+, driven by privacy-focused demand and technical upgrades. - Unlike Bitcoin's stagnant $103k price, Zcash's 28% shielded supply reflects growing demand for privacy amid regulatory scrutiny. - Investor psychology shifted toward privacy coins, with Zcash outperforming Bitcoin as capital rotated during market volatility. - Analysts predict Zcash could reach $580 if it breaks $500 resistance, contrasting Bitcoin's deflationary model with utility-drive

Bitget-RWA2025/11/07 17:44
Zcash Halving and Its Impact on the Market: Price Movements After Halving and Investor Sentiment